Fig. 4
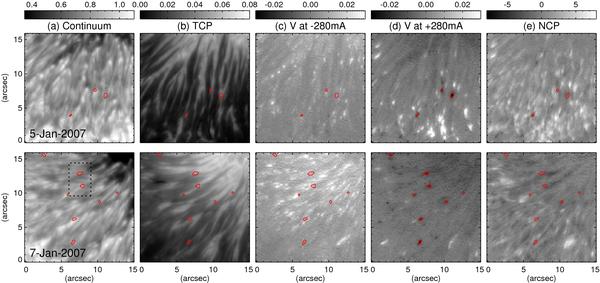
a) SP continuum images observed on 5 and 7 Jan. in the region indicated by the dashed boxes in Fig. 1, b) total circular polarization (TCP,  ) integrated over ±500 mÅ around the line center of 6301.5 Å line, c) Stokes V signals V/Icq at −280 mÅ from the line center of the 6301.5 Å line, d) Stokes V signals V/Icq at +280 mÅ from the line center of the 6301.5 Å line, and e) net circular polarization (NCP, ∫Vdλ/Ic, in the unit of mÅ) integrated over ±500 mÅ around the line center of the 6301.5 Å line, where Icq is the continuum intensity averaged in the quiet Sun and Ic is the local continuum intensity. The contours in each panel represent V/Icq = −0.015 at +280 mÅ from 6301.5 Å. The dotted box in panel a) indicates the region of interest used in Fig. 5.
Current usage metrics show cumulative count of Article Views (full-text article views including HTML views, PDF and ePub downloads, according to the available data) and Abstracts Views on Vision4Press platform.
Data correspond to usage on the plateform after 2015. The current usage metrics is available 48-96 hours after online publication and is updated daily on week days.
Initial download of the metrics may take a while.