Fig. 2
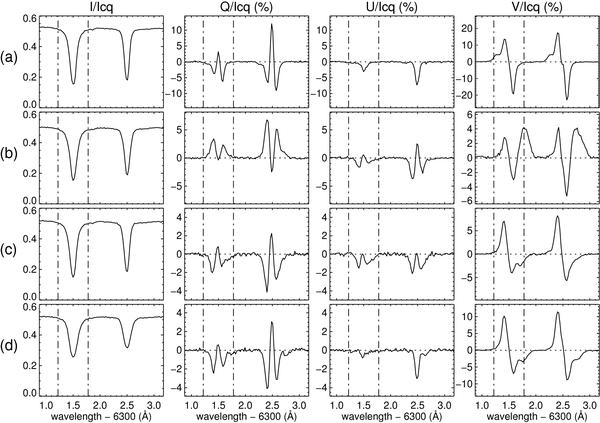
Examples of Stokes profiles seen in the sunspot penumbra observed on 5 Jan. 2007 when the spot was located close to the disk center. Profiles in the patches with enhanced positive Stokes V signals on the blue wing a), those in the patches with enhanced positive Stokes V signals on the red wing b), and those in the patches with enhanced negative Stokes V signals on the red wing (c and d). The vertical dash-dotted lines show the wavelength offsets of ±280 mÅ from 6301.5 Å, which are used to make the maps of Stokes V signals in Fig. 1.
Current usage metrics show cumulative count of Article Views (full-text article views including HTML views, PDF and ePub downloads, according to the available data) and Abstracts Views on Vision4Press platform.
Data correspond to usage on the plateform after 2015. The current usage metrics is available 48-96 hours after online publication and is updated daily on week days.
Initial download of the metrics may take a while.