Fig. 1
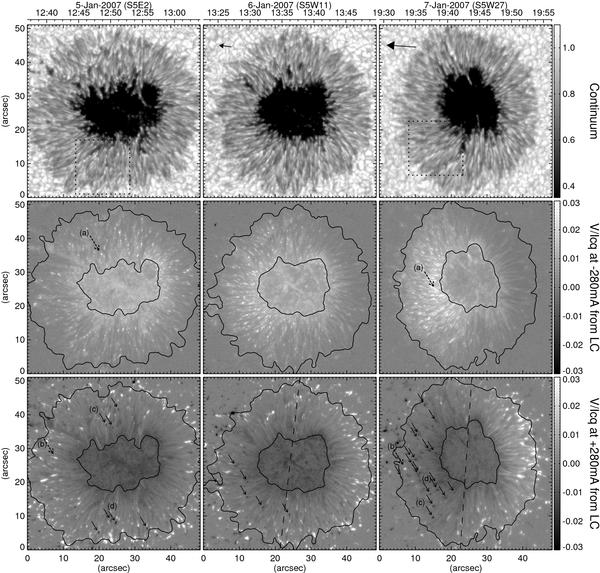
Maps of continuum intensities (top), Stokes V signals V/Icq at the blue wing (−280 mÅ from the line center, middle), and Stokes V signals V/Icq at the red wing (+280 mÅ from the line center, bottom) of the Fe I 6301.5 Å line reconstructed from the SP data, where Icq is the continuum intensity averaged in the quiet Sun. The dates and hours of the SP scanning observations are shown at the top of the maps. The arrows in the continuum images (top center and top right) indicate the direction toward the disk center. The solid arrows in the images of Stokes V on the red wing (bottom) indicate locations of small patches with enhanced negative Stokes V signals. The arrows labeled with a)–d) mark the locations where Stokes profiles are shown in Figs. 2 and 3. The two solid contours in the middle and bottom images represent boundaries between the umbra and the penumbra and between the penumbra and the quiet Sun. The dashed lines in the bottom center and bottom right images indicate boundaries separating the disk-center and the limb side. The dotted boxes in the continuum images (top left and top right) indicate the regions of interest used in Fig. 4.
Current usage metrics show cumulative count of Article Views (full-text article views including HTML views, PDF and ePub downloads, according to the available data) and Abstracts Views on Vision4Press platform.
Data correspond to usage on the plateform after 2015. The current usage metrics is available 48-96 hours after online publication and is updated daily on week days.
Initial download of the metrics may take a while.