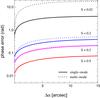
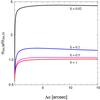
Fig. 8

Left: astrometric phase error caused by atmospheric turbulence, as the function of the angular distance Δα between the source and the reference star for both singlemode (solid lines) and multimode (dotted lines). Right: ratio of the multimode versus the singlemode astrometric error. Results are shown for various AO correction levels as described in the figures above. We have assumed one single turbulent layer located at h = 10 km.
Current usage metrics show cumulative count of Article Views (full-text article views including HTML views, PDF and ePub downloads, according to the available data) and Abstracts Views on Vision4Press platform.
Data correspond to usage on the plateform after 2015. The current usage metrics is available 48-96 hours after online publication and is updated daily on week days.
Initial download of the metrics may take a while.