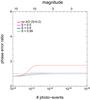
Fig. 2
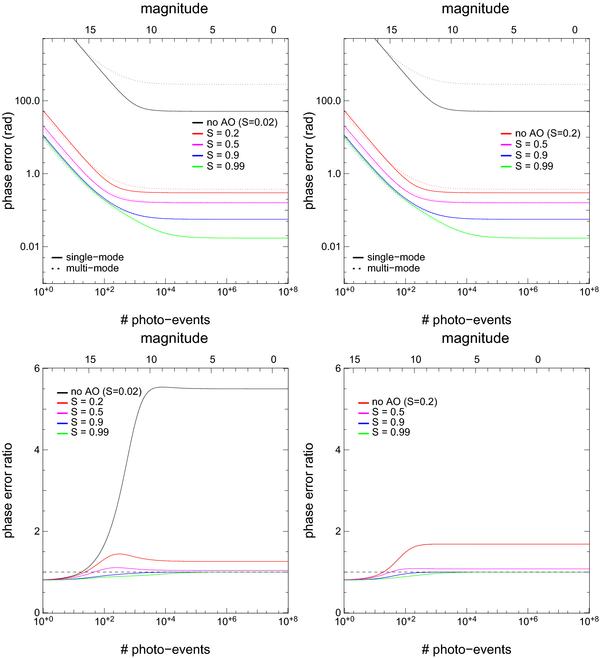
Global performance comparison between multimode and singlemode
interferometry, all sources of noise considered. Top: error of the
phase in multimode (dotted lines) and singlemode (solid lines) as the function of
the number of detected photoevents (per time unit) and K-band
magnitude. For both cases, we can see the three regimes: the detector noise (in
1/N), then (shortly) the photon noise (in
 )
and finally the speckle noise (saturation). Bottom: ratio of
multimode vs. singlemode phase error. Plots are shown for several levels of
correction (Strehl ratios). The fixed parameters are
σdet = 4e − / pix,
|Vij | = 1, Npix = 4. Two
turbulence strengths are considered
D/r0 = 8
(left) and
D/r0 = 2
(right) that correspond to the average turbulence conditions of
the VLTI with UTs (D = 8 m) and ATs (D = 1.8 m)
respectively. For the conversion between detected photoevents and magnitude scale,
we have considered a total transmission coefficient of 15%, a detector quantum
efficiency of 50%, an integration time of 30 ms and a spectral resolution of 35 with
2 pixels by spectral channel.
)
and finally the speckle noise (saturation). Bottom: ratio of
multimode vs. singlemode phase error. Plots are shown for several levels of
correction (Strehl ratios). The fixed parameters are
σdet = 4e − / pix,
|Vij | = 1, Npix = 4. Two
turbulence strengths are considered
D/r0 = 8
(left) and
D/r0 = 2
(right) that correspond to the average turbulence conditions of
the VLTI with UTs (D = 8 m) and ATs (D = 1.8 m)
respectively. For the conversion between detected photoevents and magnitude scale,
we have considered a total transmission coefficient of 15%, a detector quantum
efficiency of 50%, an integration time of 30 ms and a spectral resolution of 35 with
2 pixels by spectral channel.
Current usage metrics show cumulative count of Article Views (full-text article views including HTML views, PDF and ePub downloads, according to the available data) and Abstracts Views on Vision4Press platform.
Data correspond to usage on the plateform after 2015. The current usage metrics is available 48-96 hours after online publication and is updated daily on week days.
Initial download of the metrics may take a while.