Fig. 4
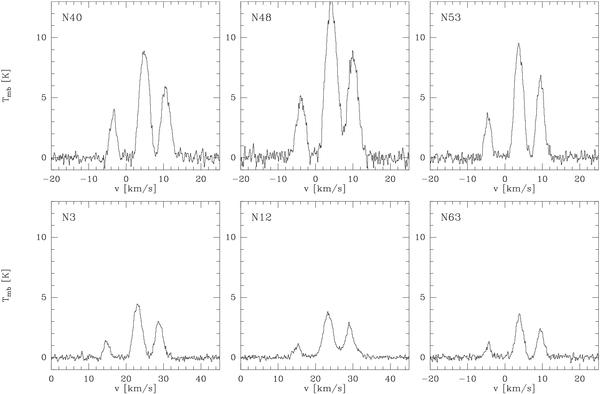
N2H+(1−0) spectra towards the center of each MDCs observed with the IRAM 30 m. Note that the velocity scale is given for the weakest line (left component), which is the only isolated component of the hyperfine structure. The other 5 components of the hyperfine structure are blended and form the 2 apparently brighter groups of lines.
Current usage metrics show cumulative count of Article Views (full-text article views including HTML views, PDF and ePub downloads, according to the available data) and Abstracts Views on Vision4Press platform.
Data correspond to usage on the plateform after 2015. The current usage metrics is available 48-96 hours after online publication and is updated daily on week days.
Initial download of the metrics may take a while.