Fig. 8
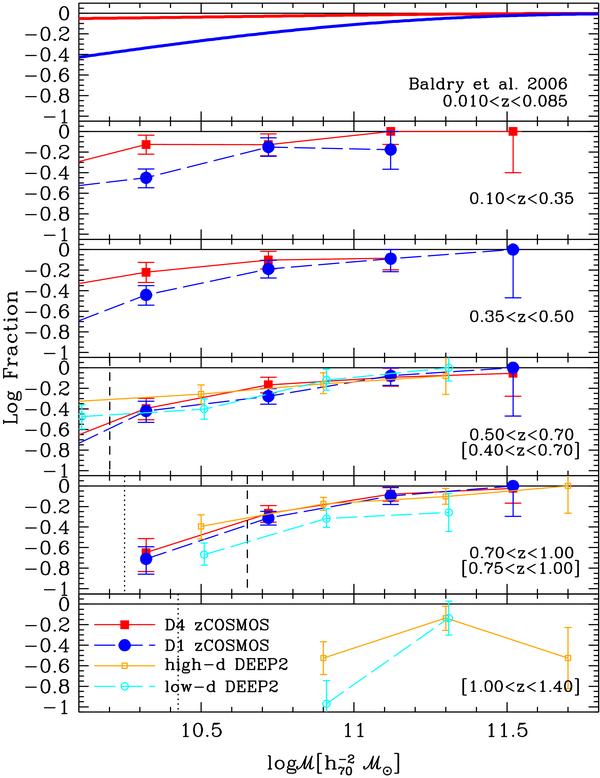
Evolution of the fractional contribution of the early-type/red galaxies to the global MFs in low and high density environments from the surveys SDSS, zCOSMOS, and DEEP2. In the low redshift bin, red and blue lines are computed from Eq. (10) by Baldry et al. (2006), representing the fraction of red galaxies in the highest and lowest environmental densities in their SDSS analysis. In the other redshift bins, red solid lines and filled squares represent the zCOSMOS high-density sample D4, and blue long-dashed lines and filled circles the low-density sample D1. Orange and cyan lines and empty symbols represent the values of the analogous fractions taken from Bundy et al. (2006). The vertical dashed lines mark ℳmin in zCOSMOS, and vertical dotted lines represent the Ks-band completeness limits in Bundy et al. (2006). Redshift ranges between brackets refer to DEEP2 binning.
Current usage metrics show cumulative count of Article Views (full-text article views including HTML views, PDF and ePub downloads, according to the available data) and Abstracts Views on Vision4Press platform.
Data correspond to usage on the plateform after 2015. The current usage metrics is available 48-96 hours after online publication and is updated daily on week days.
Initial download of the metrics may take a while.