Fig. 7
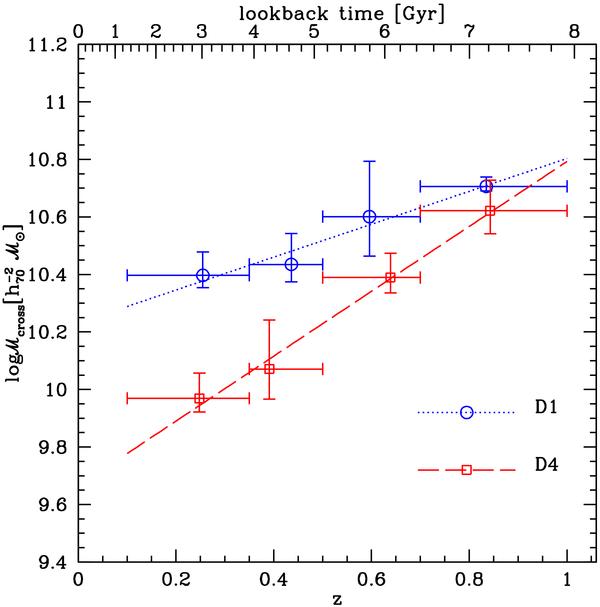
ℳcross of photometric types in the extreme quartiles D1 and D4. Blue: low-density environments. Red: high-density. The points are located at the median redshift of the early plus late samples and error bars represent the width of the redshift bin and the error in the GSMF ratio from 1/Vmax method. A linear fit to the points is also shown.
Current usage metrics show cumulative count of Article Views (full-text article views including HTML views, PDF and ePub downloads, according to the available data) and Abstracts Views on Vision4Press platform.
Data correspond to usage on the plateform after 2015. The current usage metrics is available 48-96 hours after online publication and is updated daily on week days.
Initial download of the metrics may take a while.