Fig. 6
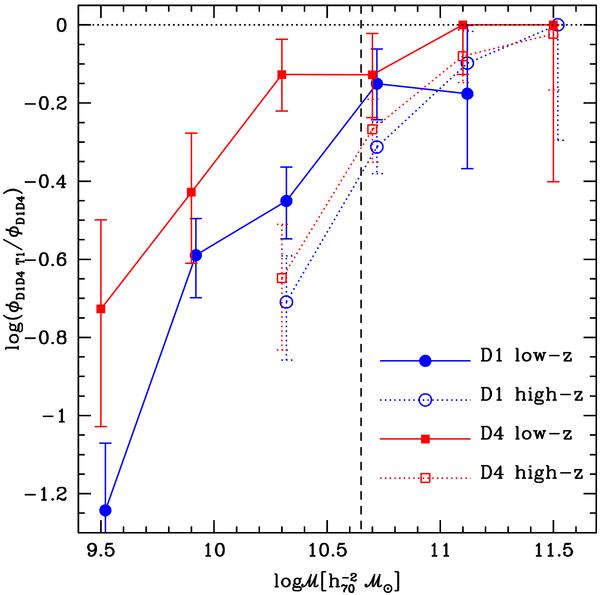
Evolution of the fractional contribution of the photometric early-type to the global MFs (the late-type fractional contribution is complementary to the one shown in this plot) in the two extreme environments. Blue lines and circles refer to the low density environment D1 (displaced by 0.02 in the abscissa to avoid overlapping), red lines and squares to the high density sample D4. Dotted lines and empty symbols represent the highest redshift bin z = [ 0.7,1.0 ] , solid lines and filled points the lowest one, z = [ 0.1,0.35 ] . The vertical dashed line indicates ℳmin in the high redshift bin (the value at low redshift is outside the plot). Error bars have been computed as 16 − 84% of the distribution of Monte Carlo simulations.
Current usage metrics show cumulative count of Article Views (full-text article views including HTML views, PDF and ePub downloads, according to the available data) and Abstracts Views on Vision4Press platform.
Data correspond to usage on the plateform after 2015. The current usage metrics is available 48-96 hours after online publication and is updated daily on week days.
Initial download of the metrics may take a while.