Fig. 3
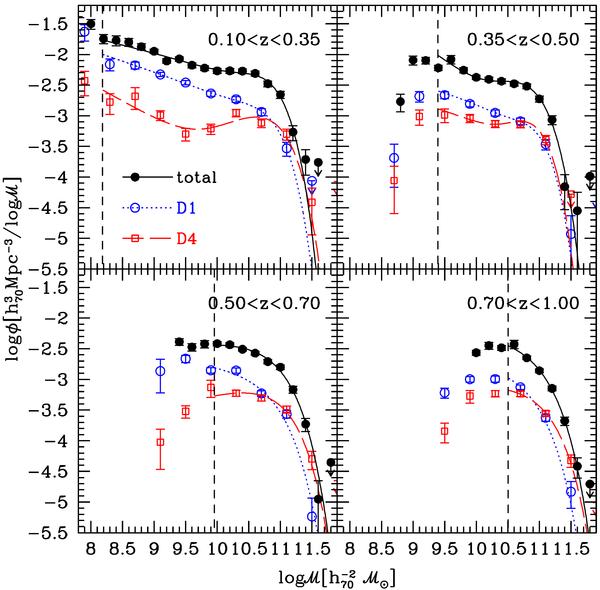
The MFs in the extreme quartiles D1 and D4 of the 5NN volume-limited overdensities. Black: total GSMF, with 1/Vmax dots and their Poissonian error bars and Schechter function fit (double Schechter function in the first two redshift ranges and a single one at higher redshifts). Blue: lowest 1 + δ quartile. Red: highest density quartile.
Current usage metrics show cumulative count of Article Views (full-text article views including HTML views, PDF and ePub downloads, according to the available data) and Abstracts Views on Vision4Press platform.
Data correspond to usage on the plateform after 2015. The current usage metrics is available 48-96 hours after online publication and is updated daily on week days.
Initial download of the metrics may take a while.