Fig. 10
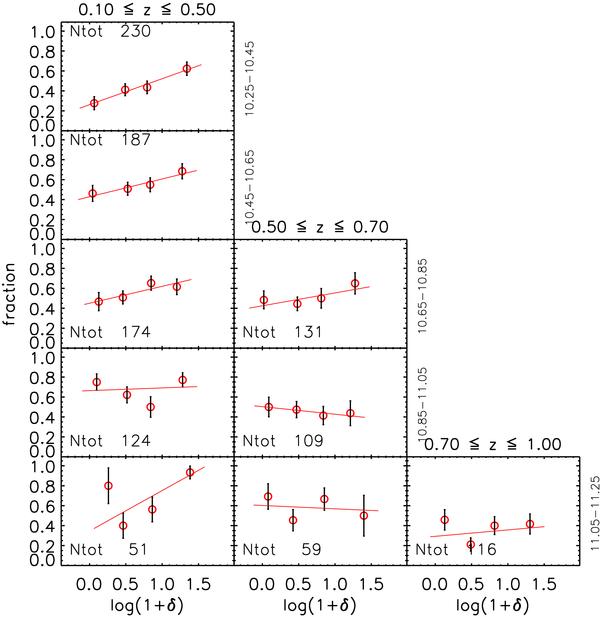
Colour-density relation using number density and volume limited tracers for subsamples of galaxies divided in three redshift bins (columns, redshift bins quoted on the top) and five mass bins (rows, mass bins quoted on the right, in logarithmic scale). For z ≤ 0.7 we use the fainter volume limited tracers (MB ≤ − 19.3 − z), for z ≥ 0.7 brighter ones (MB ≤ − 20.5 − z). Red circles show the fraction of galaxies with U − B colour redder than a threshold that depends on the stellar mass, as shown by the diagonal red line in the first panel of Fig. 11 (see also text for details). The values on the x axis are the median density values in each density bin. Red lines represent the linear fit of circles. Their slopes and associated 1σ confidence levels are quoted in Table 2. In each panel, “Ntot” is the total number of galaxies in that mass and redshift bin, while the number of galaxies satisfying the colour threshold is quoted in Table 2.
Current usage metrics show cumulative count of Article Views (full-text article views including HTML views, PDF and ePub downloads, according to the available data) and Abstracts Views on Vision4Press platform.
Data correspond to usage on the plateform after 2015. The current usage metrics is available 48-96 hours after online publication and is updated daily on week days.
Initial download of the metrics may take a while.