Fig. 8
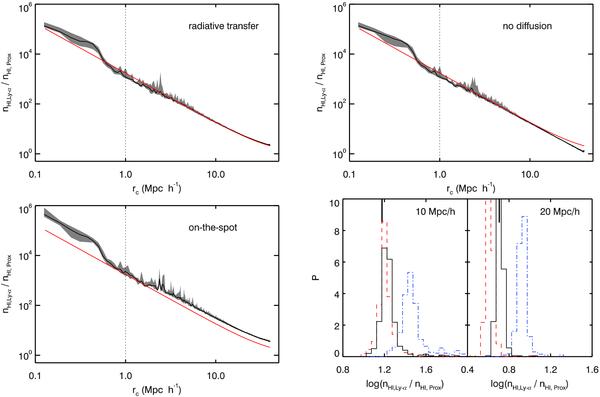
Median overionisation profile as a function of the distance from the QSO hosted by a halo as in Fig. 6. We show the influence of the diffuse field on the H ii region for LνLL = 1032 erg Hz-1 s-1 at z = 3.0. The upper left plot shows the full radiative transfer simulation, the right plot the one without diffusive radiation, and the lower left plot results using the on-the-spot approximation. The analytical overionisation profile including the SED effects is given by the solid line. The region affected by oversampling (r < 1 Mpc) is marked with a dotted line. The lower right histograms gives the distribution of the overionisation fraction at radii r = 10 Mpc h-1 (left) and r = 20 Mpc h-1 (right). The solid lines give radiation transfer results, the dashed lines shows results omitting diffusion, and the dot-dashed distribution illustrates results obtained with the on-the-spot approximation. The solid tick indicates the analytical solution.
Current usage metrics show cumulative count of Article Views (full-text article views including HTML views, PDF and ePub downloads, according to the available data) and Abstracts Views on Vision4Press platform.
Data correspond to usage on the plateform after 2015. The current usage metrics is available 48-96 hours after online publication and is updated daily on week days.
Initial download of the metrics may take a while.