Fig. 6
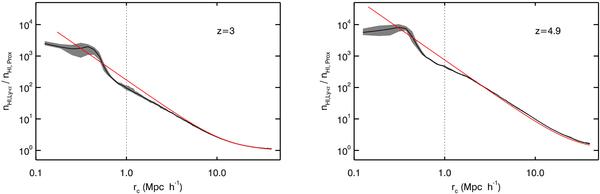
Median overionisation profile as a function of the distance from the QSO (black line, grey area gives upper and lower quartiles) hosted by a halo at z = 3.0 (left) and z = 4.9 (right side) for a QSO luminosity LνLL = 1 × 1031 erg Hz-1 s-1. The analytical overionisation profile including the SED effects is given by the solid line without the grey area. The region affected by oversampling (r < 1 Mpc) is marked with a dotted line.
Current usage metrics show cumulative count of Article Views (full-text article views including HTML views, PDF and ePub downloads, according to the available data) and Abstracts Views on Vision4Press platform.
Data correspond to usage on the plateform after 2015. The current usage metrics is available 48-96 hours after online publication and is updated daily on week days.
Initial download of the metrics may take a while.