Fig. 2
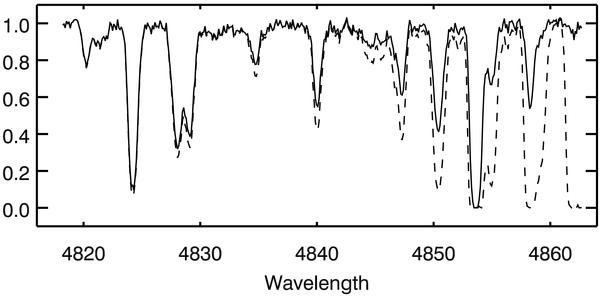
Mock spectra synthesised from the z = 3 snapshot with a QSO in a filament. The QSO sits on the right hand side of each spectrum, and the wavelength is in Ångström. The dashed line gives the Lyα forest spectrum without the influence of the QSO, the solid line the spectrum from the radiative transfer simulation of the proximity effect for a QSO with a Lyman limit luminosity of LνLL = 1031 erg Hz-1 s-1. The spectra have a resolution of Δv = 6.7 km s-1 and a signal-to-noise ratio of 70.
Current usage metrics show cumulative count of Article Views (full-text article views including HTML views, PDF and ePub downloads, according to the available data) and Abstracts Views on Vision4Press platform.
Data correspond to usage on the plateform after 2015. The current usage metrics is available 48-96 hours after online publication and is updated daily on week days.
Initial download of the metrics may take a while.