Fig. A.2
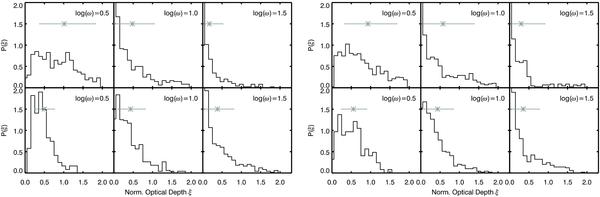
Normalised optical depth ξ distribution of the void (left panel) and filament QSO (right panel) at redshift z = 3 for three log ω bins. The upper panels show results for the LνLL = 1031 erg Hz-1 s-1 QSOs, the lower one for the LνLL = 1032 erg Hz-1 s-1 QSO. The grey data points give the average normalised optical depths with their variance as shown in Fig. 12.
Current usage metrics show cumulative count of Article Views (full-text article views including HTML views, PDF and ePub downloads, according to the available data) and Abstracts Views on Vision4Press platform.
Data correspond to usage on the plateform after 2015. The current usage metrics is available 48-96 hours after online publication and is updated daily on week days.
Initial download of the metrics may take a while.