Fig. A.1
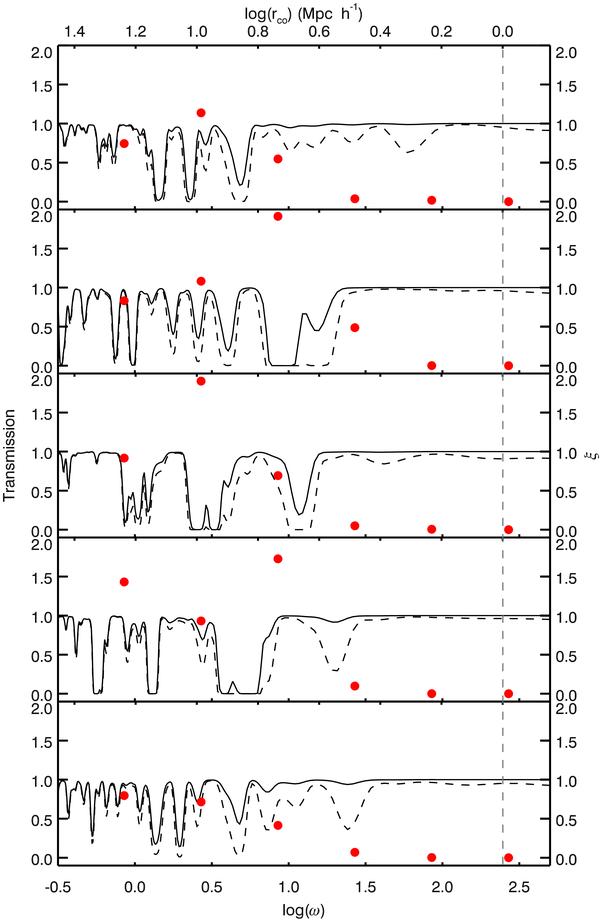
Sample spectra taken from the z = 3 low luminosity QSO located in a void showing the radiative transfer simulations including the proximity effect (solid line) and without it (dashed line). The spectra are given in log ω scale and for better visibility, no noise has been added to the spectra. The normalised optical depths ξ at each log ω bin is overplotted by solid dots to show the effect of absorption features on ξ. The dashed vertical line marks the start of the unreliability region of log ω ≥ 2.4.
Current usage metrics show cumulative count of Article Views (full-text article views including HTML views, PDF and ePub downloads, according to the available data) and Abstracts Views on Vision4Press platform.
Data correspond to usage on the plateform after 2015. The current usage metrics is available 48-96 hours after online publication and is updated daily on week days.
Initial download of the metrics may take a while.