Fig. 11
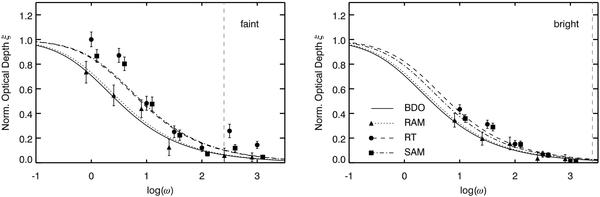
Comparison of the proximity effect at redshift z = 3 of a) the RAM (triangles and dotted line), b) the semi-analytical model (circles and dash dotted line), and c) the results from the radiative transfer simulation (squares and dashed line). The solid line shows the BDO reference analytical model. The dashed vertical line marks the start of the unreliability region of log ω ≥ 2.4 for the faint QSO and log ω ≥ 3.4 for the bright QSO. Results are shown for a QSO sitting in a filament. The left panel is for the low luminosity source, and the right one for the high luminous one. We show only the 2σ errors in the mean.
Current usage metrics show cumulative count of Article Views (full-text article views including HTML views, PDF and ePub downloads, according to the available data) and Abstracts Views on Vision4Press platform.
Data correspond to usage on the plateform after 2015. The current usage metrics is available 48-96 hours after online publication and is updated daily on week days.
Initial download of the metrics may take a while.