Fig. 10
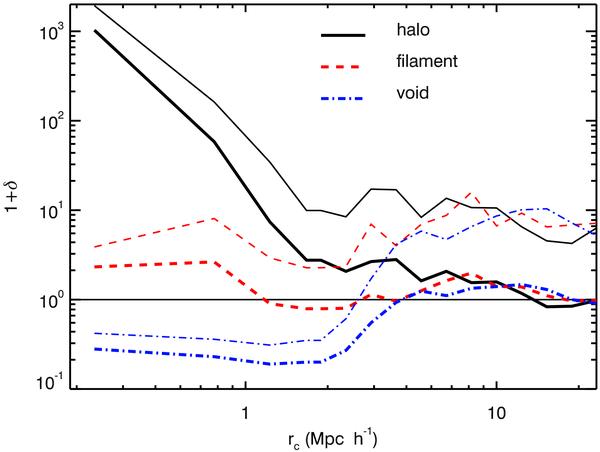
The mean overdensity profiles of the halo (solid line), filament (dashed line), and void (dash-dotted line) environment at redshift z = 3 as a function of comoving radius. The mean profiles are shown by thick lines. The thin lines indicate the 1σ fluctuations in the density field. An excess in overdensity is seen for all environments in the range of 3 < rc < 10 Mpc h-1, where the profile stays above the average overdensity.
Current usage metrics show cumulative count of Article Views (full-text article views including HTML views, PDF and ePub downloads, according to the available data) and Abstracts Views on Vision4Press platform.
Data correspond to usage on the plateform after 2015. The current usage metrics is available 48-96 hours after online publication and is updated daily on week days.
Initial download of the metrics may take a while.