Fig. 1
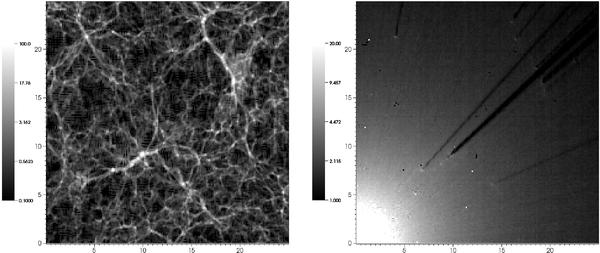
Cuts through the 25 Mpc h-1 simulation box at redshift z = 4 for a QSO sitting in the void at the lower left corner. In the left panel, the overdensity field 1 + δ is shown. The right panel provides the inverse of the overionisation fraction nHi,Ly − α/nHi,prox due to a LνLL = 1031 erg Hz-1 s-1 QSO. Here nHi,Ly − α and nHi,prox are the neutral hydrogen fractions without and with the influence of the QSO respectively. Clearly visible are the extended overionisation zone and shadowing effects. The scattered white dots arise from numerical noise. The axes are in comoving h-1 Mpc.
Current usage metrics show cumulative count of Article Views (full-text article views including HTML views, PDF and ePub downloads, according to the available data) and Abstracts Views on Vision4Press platform.
Data correspond to usage on the plateform after 2015. The current usage metrics is available 48-96 hours after online publication and is updated daily on week days.
Initial download of the metrics may take a while.