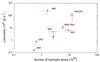
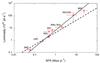
Fig. 3

Gamma-ray >100 MeV luminosity versus total number of hydrogen atoms (top panel) and star formation rate (bottom panel) for Local Group galaxies and the starbursts M 82 and NGC 253. In the bottom panel, the lines are power-law fits to the data for the MW, M 31, the LMC, and the SMC, for which the slope was free (solid) or fixed to 1 (dashed).
Current usage metrics show cumulative count of Article Views (full-text article views including HTML views, PDF and ePub downloads, according to the available data) and Abstracts Views on Vision4Press platform.
Data correspond to usage on the plateform after 2015. The current usage metrics is available 48-96 hours after online publication and is updated daily on week days.
Initial download of the metrics may take a while.