Free Access
Fig. 2
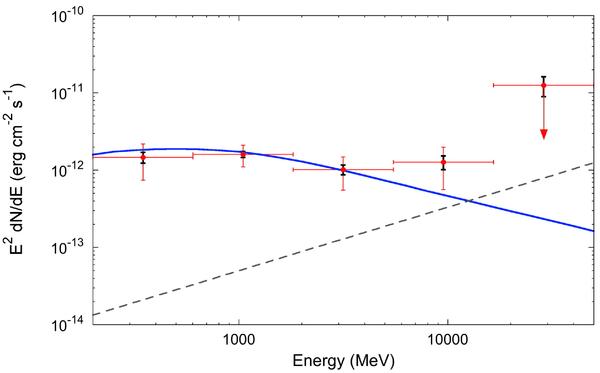
Spectrum of the M 31 emission obtained using the IRIS 100 μm spatial template. Red error bars are statistical, black error bars are systematic uncertainties. The solid line shows an MW gamma-ray luminosity model scaled to M 31 and the dashed one a possible contribution of 1ES 0037+405 (see text).
Current usage metrics show cumulative count of Article Views (full-text article views including HTML views, PDF and ePub downloads, according to the available data) and Abstracts Views on Vision4Press platform.
Data correspond to usage on the plateform after 2015. The current usage metrics is available 48-96 hours after online publication and is updated daily on week days.
Initial download of the metrics may take a while.