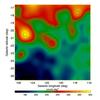
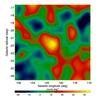
Fig. 1

Gaussian kernel (σ = 0.5°) smoothed counts maps of the region of interest (ROI) in a true local projection before (left) and after subtraction of the background model (right) for the energy range 200 MeV–20 GeV and for a pixel size of 0.05° × 0.05°. Overlaid are IRIS 100 μm contours of M 31 convolved with the LAT point spread function to indicate the extent and shape of the galaxy. The boxes show the locations of the 4 point sources that have been included in the background model.
Current usage metrics show cumulative count of Article Views (full-text article views including HTML views, PDF and ePub downloads, according to the available data) and Abstracts Views on Vision4Press platform.
Data correspond to usage on the plateform after 2015. The current usage metrics is available 48-96 hours after online publication and is updated daily on week days.
Initial download of the metrics may take a while.