Fig. 3
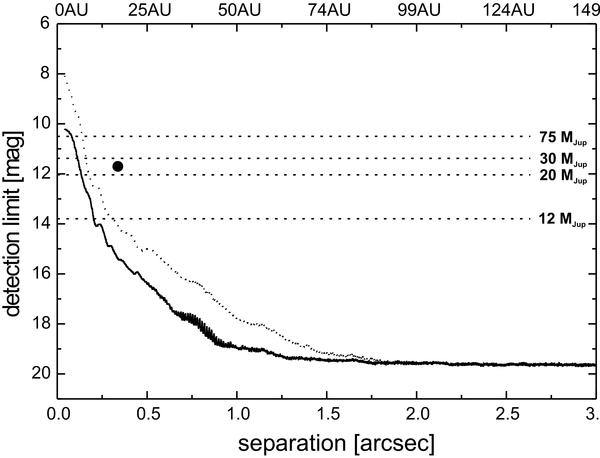
The average detection limit of our deep NACO image taken in the Ks-band in September 2009 plotted for a range of angular (bottom) and projected separation (top). The detection limit achieved in this image is shown as a dotted line, as well as the detection limit after PSF subtraction (solid line). Because of saturation, objects within a separation of 3 NACO pixels (or 40 mas of angular separation) cannot be detected around the bright primary. The position of PZ Tel B is indicated as black circle. Dashed horizontal lines show the expected brightness of substellar objects, whose masses are listed at the right side of the plot.
Current usage metrics show cumulative count of Article Views (full-text article views including HTML views, PDF and ePub downloads, according to the available data) and Abstracts Views on Vision4Press platform.
Data correspond to usage on the plateform after 2015. The current usage metrics is available 48-96 hours after online publication and is updated daily on week days.
Initial download of the metrics may take a while.