Fig. 10
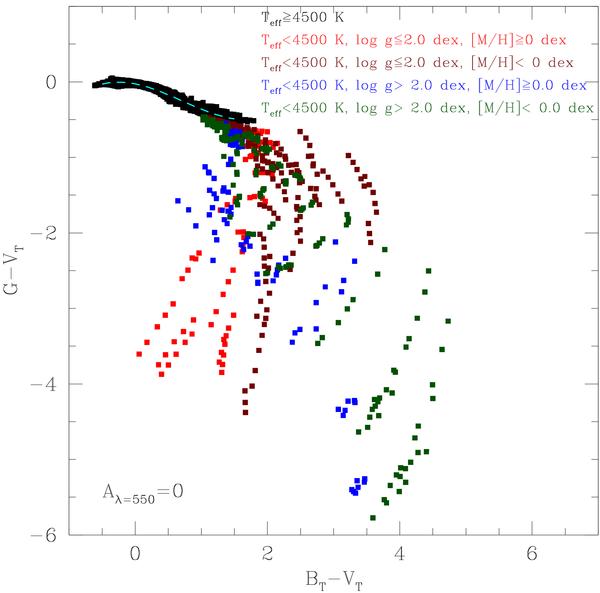
Colour–colour diagrams involving Gaia G and Tycho colour. No extinction has been considered. The stars are separated in effective temperature, surface gravity, and metallicity. The plot is very similar to the one displaying (G − V) − (B − V). Dashed line corresponds to the fitting in Table 4.
Current usage metrics show cumulative count of Article Views (full-text article views including HTML views, PDF and ePub downloads, according to the available data) and Abstracts Views on Vision4Press platform.
Data correspond to usage on the plateform after 2015. The current usage metrics is available 48-96 hours after online publication and is updated daily on week days.
Initial download of the metrics may take a while.