Fig. 5
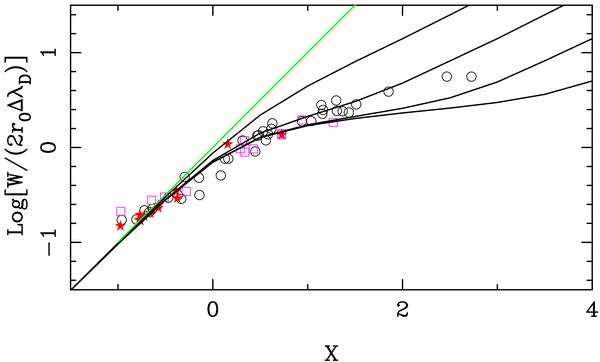
Curve of growth for Fe ii lines using oscillator strengths from Meléndez & Barbuy (2009). Unit slope is indicated by the solid gray line. Along this line, the ordinate, and the abscissa (X), are equal. SS model curves are drawn for a = γλ / (2·ΔλD) of 1, 0.1, 0.01, and 0.001 (from the top). The abscissae for the points are log (gfλ) − θ·χ. Open circles are for 2.58 ≤ χ ≤ 2.89, open squares for 3.20 ≤ χ ≤ 3.89, and filled stars for 5.51 ≤ χ ≤ 6.22 eV. The observed points have been made to coincide by adding +5.7 to the abscissa, and −0.6 to the ordinate. The latter figure is relevant for the microturbulence. This plot was made with θ = 0.7 (7200 K).
Current usage metrics show cumulative count of Article Views (full-text article views including HTML views, PDF and ePub downloads, according to the available data) and Abstracts Views on Vision4Press platform.
Data correspond to usage on the plateform after 2015. The current usage metrics is available 48-96 hours after online publication and is updated daily on week days.
Initial download of the metrics may take a while.