Free Access
Fig. 5
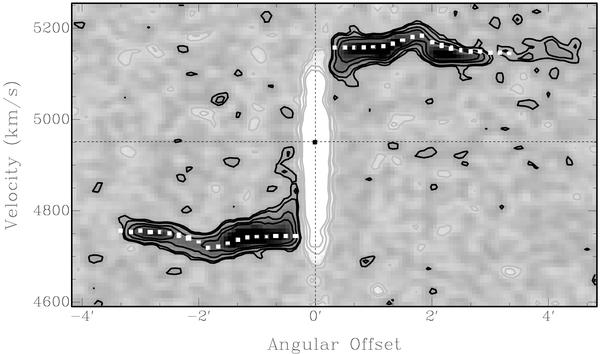
Position-velocity slice along the major axis. The white squares give the rotation curve as derived from modelling (see Sect. 5). The bump in the rotation curve is clearly visible. Contour levels: –9, –6, –3, –2 (thin black), 2, 3, 6 and 9σ (thick black). The horizontal dashed line indicates the systemic velocity.
Current usage metrics show cumulative count of Article Views (full-text article views including HTML views, PDF and ePub downloads, according to the available data) and Abstracts Views on Vision4Press platform.
Data correspond to usage on the plateform after 2015. The current usage metrics is available 48-96 hours after online publication and is updated daily on week days.
Initial download of the metrics may take a while.