Fig. 4
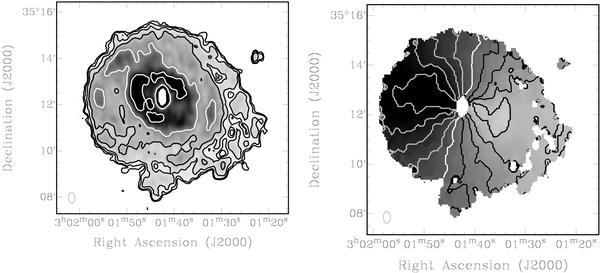
Left panel: total H i intensity map of NGC 1167. Contour levels are: 1, 2, 4, 8, 16 and 32 × 1019 atoms cm-2. Right panel: velocity field based on the peak of the profile (see text). The white contour indicates the systemic velocity, 4951 km s-1, the black and grey contours give the velocity in increments of 50 km s-1. The approaching side is to the East. The beam is indicated in the lower left corners.
Current usage metrics show cumulative count of Article Views (full-text article views including HTML views, PDF and ePub downloads, according to the available data) and Abstracts Views on Vision4Press platform.
Data correspond to usage on the plateform after 2015. The current usage metrics is available 48-96 hours after online publication and is updated daily on week days.
Initial download of the metrics may take a while.