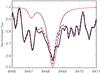
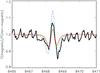
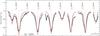
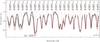
Fig. 4
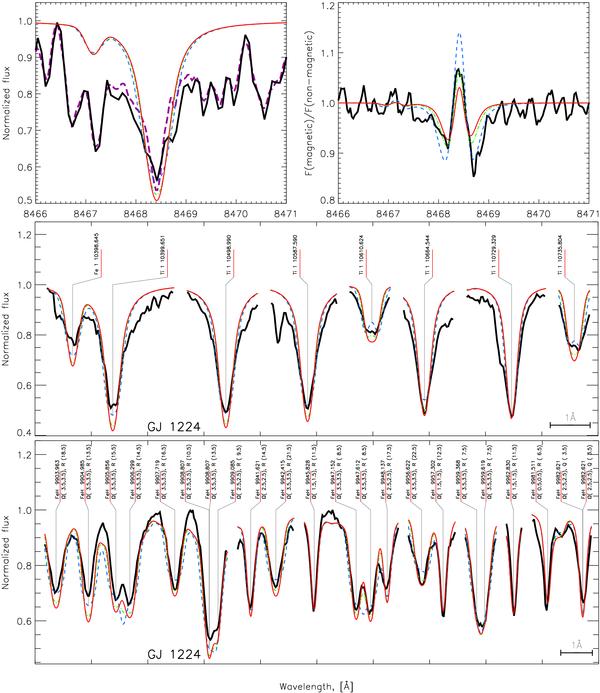
Comparison between observed and theoretical spectra of the M 4.5 dwarf GJ 1224. Upper panel: observed and calculated spectra at the Fe i 8468 Å line (left plot) and the ratio between corresponding magnetic and non-magnetic spectra (right plot). Thick solid line – observations of GJ 1224, violet long-dashed line – observations of inactive LHS 337. Middle and lower panels: same as in Fig. 3. Model parameters: Teff = 3200 K, log g = 5.0, εFe = −4.45, υsini = 3 km s-1. Thick solid line – observations, blue dashed line – B = (2.7,0,0) kG, green dash-dotted – B = (2,0,0) kG, red solid line – B = (1.7,0,0) kG. Wavelengths are in air for upper plots and in vacuum for the middle and lower plots.
Current usage metrics show cumulative count of Article Views (full-text article views including HTML views, PDF and ePub downloads, according to the available data) and Abstracts Views on Vision4Press platform.
Data correspond to usage on the plateform after 2015. The current usage metrics is available 48-96 hours after online publication and is updated daily on week days.
Initial download of the metrics may take a while.