Fig. 2
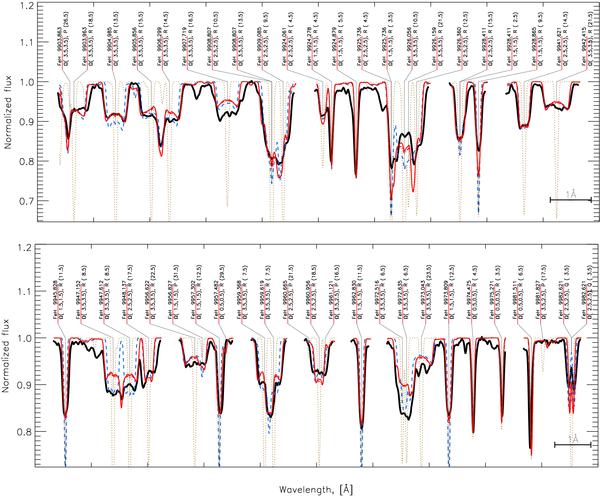
Comparison between observed and theoretical sunspot spectra in selected regions of FeH transitions. Blue dashed line – best-fitted g-factor from Afram et al. (2008), red solid line – calculations with MZL library; both with a purely radial field of B = (2.7,0,0) kG. Red dash-dotted line – synthetic spectra accounted for the horizontal field component B = (2.5,1,0) kG (hardly seen in the figure, coincides with red solid line), brown dotted line – zero-field spectrum. Labels over lines indicate their central wavelengths, omegas of lower and upper states (in brackets), branch, and the J-number of the lower state (in brackets). Wavelengths are in vacuum.
Current usage metrics show cumulative count of Article Views (full-text article views including HTML views, PDF and ePub downloads, according to the available data) and Abstracts Views on Vision4Press platform.
Data correspond to usage on the plateform after 2015. The current usage metrics is available 48-96 hours after online publication and is updated daily on week days.
Initial download of the metrics may take a while.