Fig. 6
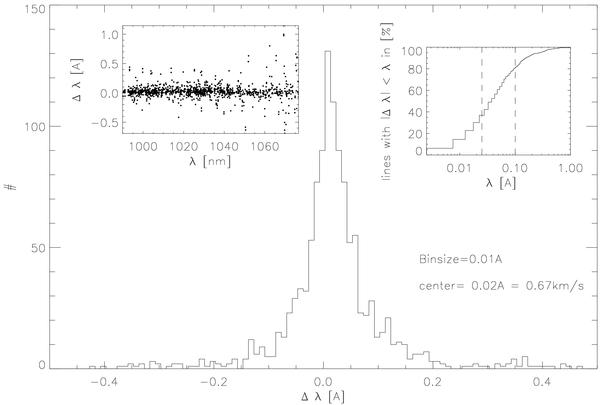
Histogram of the residuals between computed line positions and observed ones. In the upper left corner, the residuals are plotted against wavelength. In the upper right corner, the fraction of lines with residuals lower than a certain value are plotted. The left dashed line represents the accuracy of the wavelength solution which is 0.025 Å, the right one the detection boundary of 0.1 Å .
Current usage metrics show cumulative count of Article Views (full-text article views including HTML views, PDF and ePub downloads, according to the available data) and Abstracts Views on Vision4Press platform.
Data correspond to usage on the plateform after 2015. The current usage metrics is available 48-96 hours after online publication and is updated daily on week days.
Initial download of the metrics may take a while.