Fig. 16
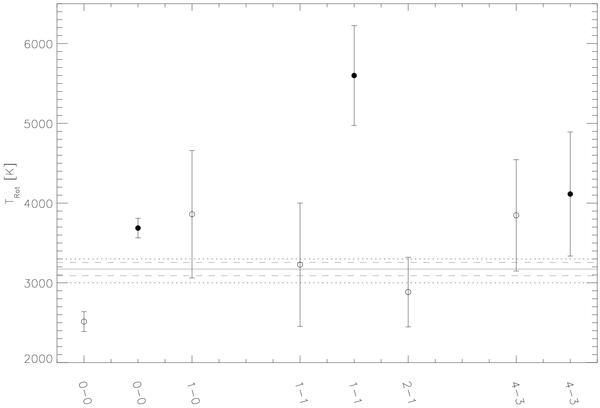
Rotational temperatures derived from the slope of the linear fits in Fig. 9. The error bars indicate the one sigma level. The dotted lines give the expected upper and lower effective temperatures for a 5.5 M-dwarf. The grey solid line is the weighted mean of the rotational temperatures with its one sigma error (dashed-line).
Current usage metrics show cumulative count of Article Views (full-text article views including HTML views, PDF and ePub downloads, according to the available data) and Abstracts Views on Vision4Press platform.
Data correspond to usage on the plateform after 2015. The current usage metrics is available 48-96 hours after online publication and is updated daily on week days.
Initial download of the metrics may take a while.