Fig. 10
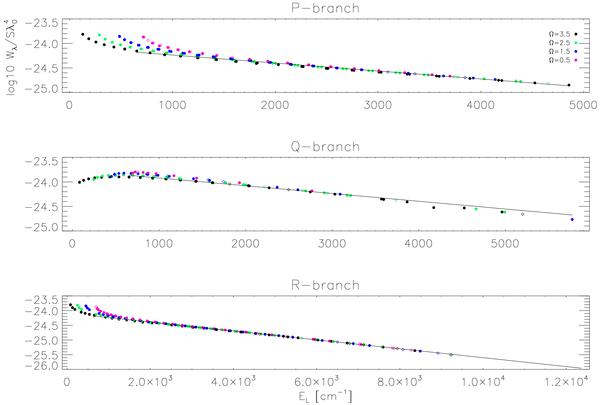
Logarithm of the computed equivalent width and theoretical line strength against lower level energies for the (0,0) band. In each plot a linear fit to the data is shown. Different colors of the data points belong to different Ω values. Dots represent lines which are identified within 0.1 Å, and diamonds lines which differ more than 0.1 Å from the theoretical position.
Current usage metrics show cumulative count of Article Views (full-text article views including HTML views, PDF and ePub downloads, according to the available data) and Abstracts Views on Vision4Press platform.
Data correspond to usage on the plateform after 2015. The current usage metrics is available 48-96 hours after online publication and is updated daily on week days.
Initial download of the metrics may take a while.