Fig. 6
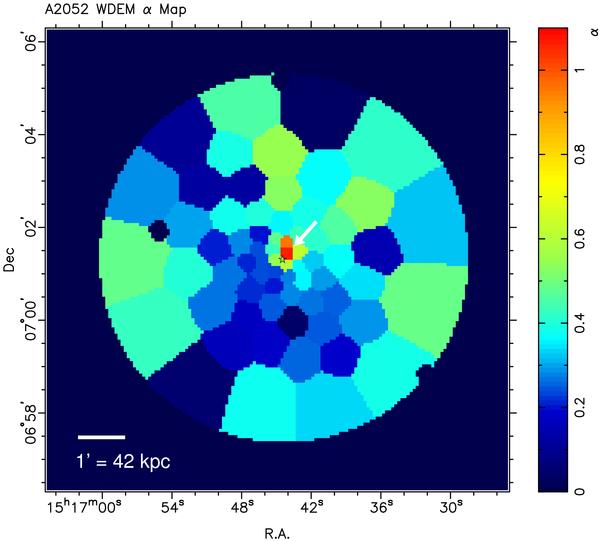
Map of the value of the α parameter in the wdem model with β fixed to 0.1. The higher the α parameter, the higher the relative contribution of cooler components in the spectrum. The error on the α parameter is less than 30% across the image, except for the bins where the value of α is nearly zero. These bins are within 2σ significance consistent with their neighbours which have higher α values. In the central region, the typical uncertainty is less than 10%. In the core, a star symbol marks the centre of the main cD galaxy and the white arrow points out the bins with the highest α value.
Current usage metrics show cumulative count of Article Views (full-text article views including HTML views, PDF and ePub downloads, according to the available data) and Abstracts Views on Vision4Press platform.
Data correspond to usage on the plateform after 2015. The current usage metrics is available 48-96 hours after online publication and is updated daily on week days.
Initial download of the metrics may take a while.