Free Access
Fig. 4
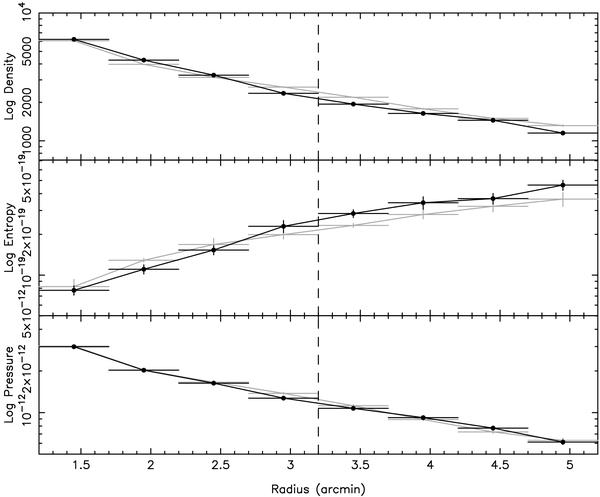
Profiles of the derived density (m-3, upper panel), entropy (N m3, middle panel), and pressure (N m-2, lower panel) from the cool South-Western region (black) and the opposite North-Eastern side (gray) of Abell 2052. The dashed vertical line indicates the position of the surface brightness discontinuity.
Current usage metrics show cumulative count of Article Views (full-text article views including HTML views, PDF and ePub downloads, according to the available data) and Abstracts Views on Vision4Press platform.
Data correspond to usage on the plateform after 2015. The current usage metrics is available 48-96 hours after online publication and is updated daily on week days.
Initial download of the metrics may take a while.