Fig. 1
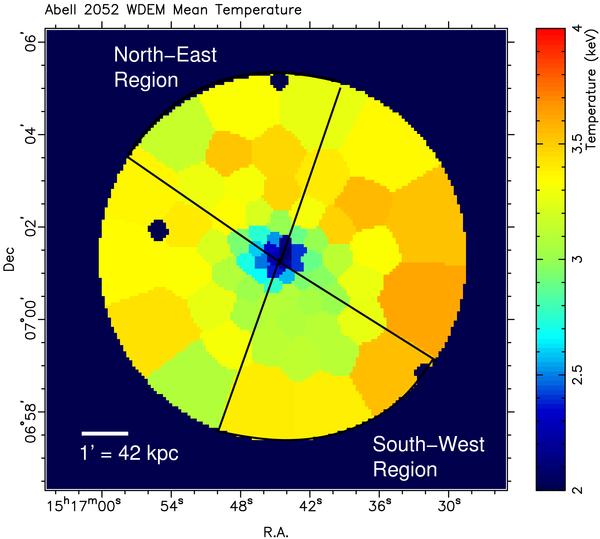
Mean temperature map derived from wdem fits to all spectra extracted from the bins in the picture above. The temperatures vary from 2 keV in the core up to 3.6 keV in the outer parts of the cluster. The error on the temperature in the majority of the bins is less than 10%. In the core, a star symbol marks the centre of the main cD galaxy. The areas indicated by the thick lines are the regions used to compare the radial profiles in the Northern-Eastern and South-Western parts of the cluster.
Current usage metrics show cumulative count of Article Views (full-text article views including HTML views, PDF and ePub downloads, according to the available data) and Abstracts Views on Vision4Press platform.
Data correspond to usage on the plateform after 2015. The current usage metrics is available 48-96 hours after online publication and is updated daily on week days.
Initial download of the metrics may take a while.