Fig. 3
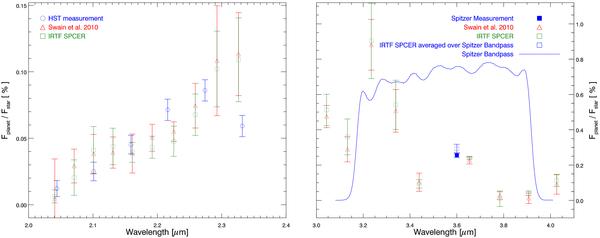
Dayside emission spectrum. The K-band (left) and L-band (right) HD 189733b emission spectrum obtained using SPCER is shown using green squares and is compared to the space-based HST spectrum (Swain et al. 2009a) and Spitzer broad-band photometry (Charbonneau et al. 2008) and the ground-based spectrum reported in Swain et al. (2010). We also show the Spitzer passband (blue line) for the 3.6μm photometric point and have averaged the SPCER result over this passband to make comparison easy (blue open symbol). There is excellent agreement between the space and ground-based datasets.
Current usage metrics show cumulative count of Article Views (full-text article views including HTML views, PDF and ePub downloads, according to the available data) and Abstracts Views on Vision4Press platform.
Data correspond to usage on the plateform after 2015. The current usage metrics is available 48-96 hours after online publication and is updated daily on week days.
Initial download of the metrics may take a while.