Fig. 2
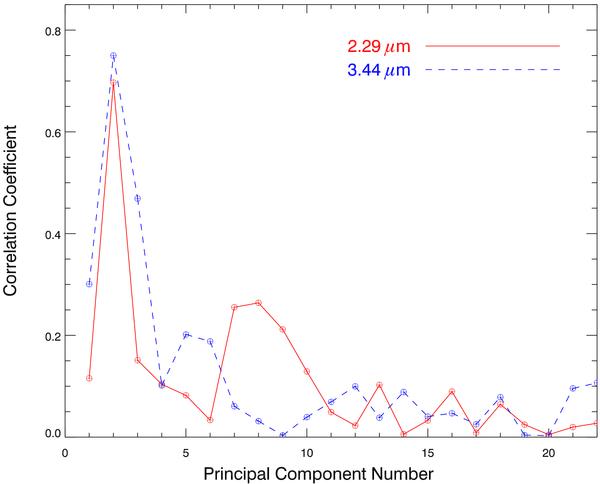
Selecting the principal components which capture the exoplanet eclipse. The linear correlation coefficients between the PCs and the model eclipse light curve are shown for representative wavelengths for the K and L-band. The eclipse is captured by PCs with a high correlation coefficient. The selection of PCs is rather straightforward with very large correlation coefficients being found at low PC numbers.
Current usage metrics show cumulative count of Article Views (full-text article views including HTML views, PDF and ePub downloads, according to the available data) and Abstracts Views on Vision4Press platform.
Data correspond to usage on the plateform after 2015. The current usage metrics is available 48-96 hours after online publication and is updated daily on week days.
Initial download of the metrics may take a while.