Fig. 1
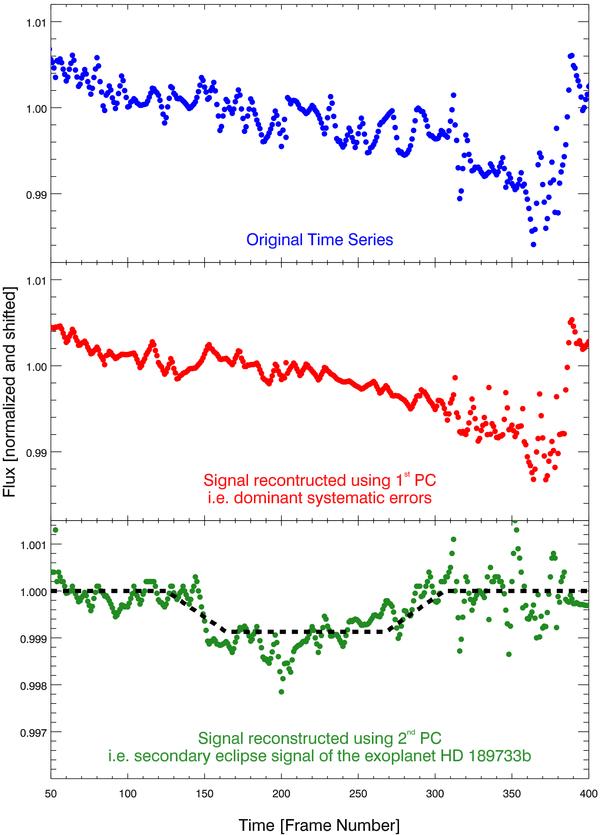
Separating the astrophysical signal from systematic errors. The different panels depict: top: an original, normalized and airmass corrected time series, middle: signal reconstructed using the first PC, bottom: signal reconstructed using the second PC. In the bottom panel, we show using a black dashed line the secondary eclipse lightcurve overplotted on the reconstructed data. The singular value decomposition of a set of time series at different wavelengths allows us to extract the exoplanet signature, largely free of systematic errors. We show the data at the original, unbinned time sampling.
Current usage metrics show cumulative count of Article Views (full-text article views including HTML views, PDF and ePub downloads, according to the available data) and Abstracts Views on Vision4Press platform.
Data correspond to usage on the plateform after 2015. The current usage metrics is available 48-96 hours after online publication and is updated daily on week days.
Initial download of the metrics may take a while.