Fig. 2
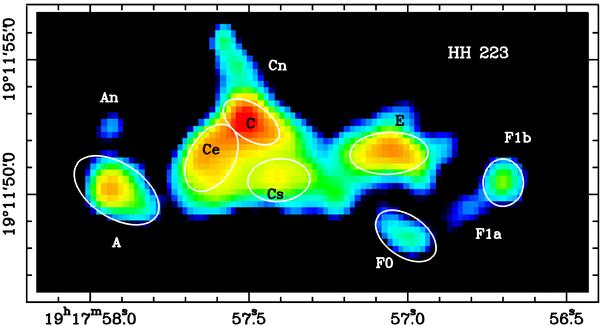
Close-up of the continuum-subtracted H2 image showing the structure of the HH 223 emission at the centre of the L723 field. The emission substructures referred to in Col. 1 of Table 2 have been labeled. The white ellipses enclose the regions which correspond to the emission-line fluxes referred to in Cols. 3 and 4 of Table 2.
Current usage metrics show cumulative count of Article Views (full-text article views including HTML views, PDF and ePub downloads, according to the available data) and Abstracts Views on Vision4Press platform.
Data correspond to usage on the plateform after 2015. The current usage metrics is available 48-96 hours after online publication and is updated daily on week days.
Initial download of the metrics may take a while.