Fig. 9
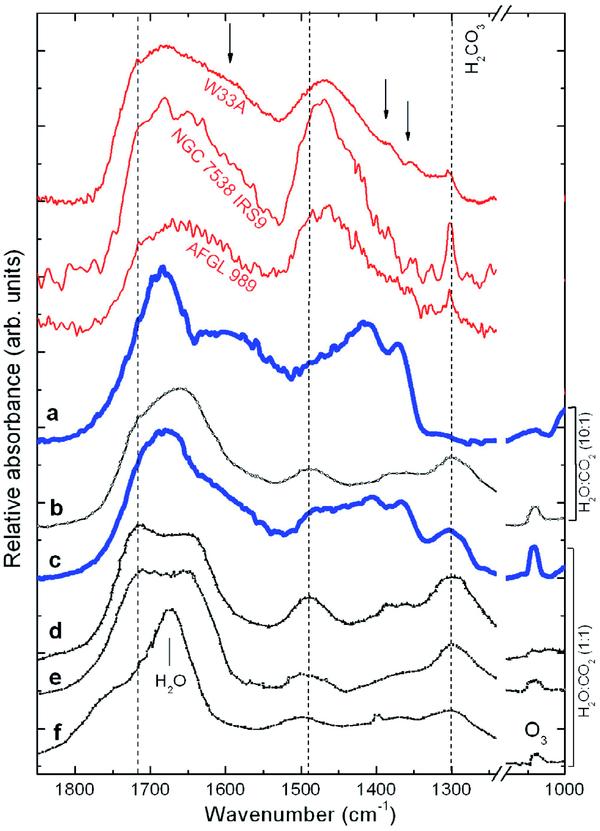
Comparison between IR spectra of interstellar and laboratory ices. The top three curves are infrared spectra of young stellar sources obtained by the Infrared Space Observatory (ISO). Lower traces indicate different laboratory spectra of irradiated H2O:CO2 ices: a) and c) (this work); b) (Hudson & Moore 2001); d) (Gerakines et al. 2000); e) (Strazzulla et al. 2005b); f) (UV photons, Gerakines et al. 2000). Vertical dashed lines indicate the location of vibrational modes of frozen H2CO3.
Current usage metrics show cumulative count of Article Views (full-text article views including HTML views, PDF and ePub downloads, according to the available data) and Abstracts Views on Vision4Press platform.
Data correspond to usage on the plateform after 2015. The current usage metrics is available 48-96 hours after online publication and is updated daily on week days.
Initial download of the metrics may take a while.