Free Access
Fig. 1
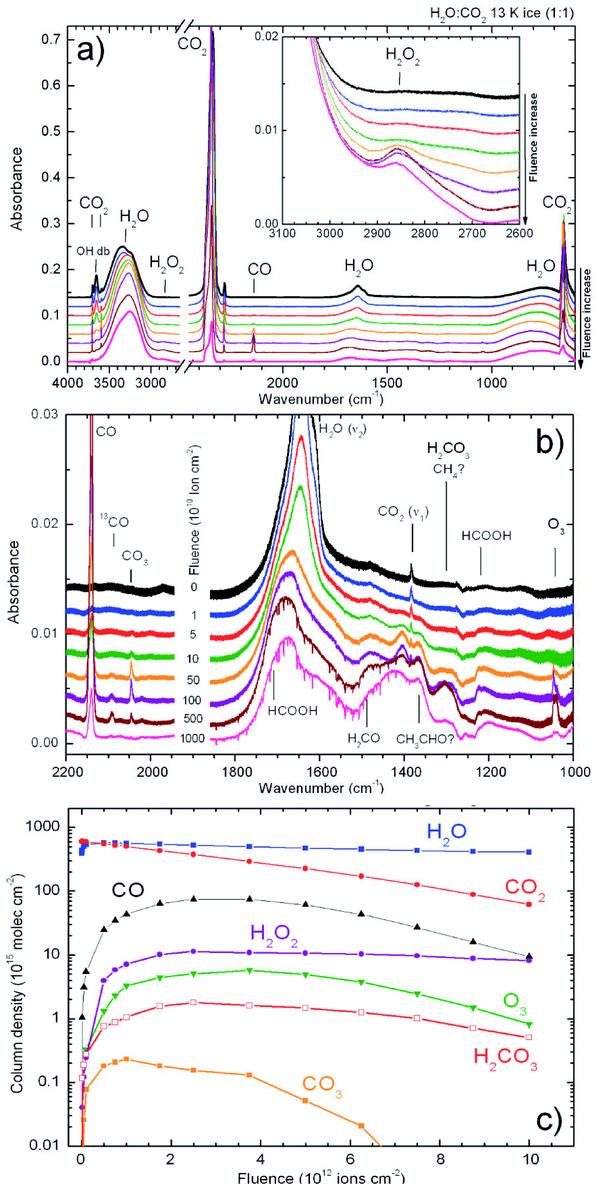
a) Infrared spectra of H2O:CO2 13 K ice (1:1) before (top dark line) and after different irradiation fluences. b) Expanded view from 2200 to 1000 cm-1. c) Molecular column densities derived from the infrared spectra during the experiment. The lines are added to guide the eyes.
Current usage metrics show cumulative count of Article Views (full-text article views including HTML views, PDF and ePub downloads, according to the available data) and Abstracts Views on Vision4Press platform.
Data correspond to usage on the plateform after 2015. The current usage metrics is available 48-96 hours after online publication and is updated daily on week days.
Initial download of the metrics may take a while.