Fig. 3
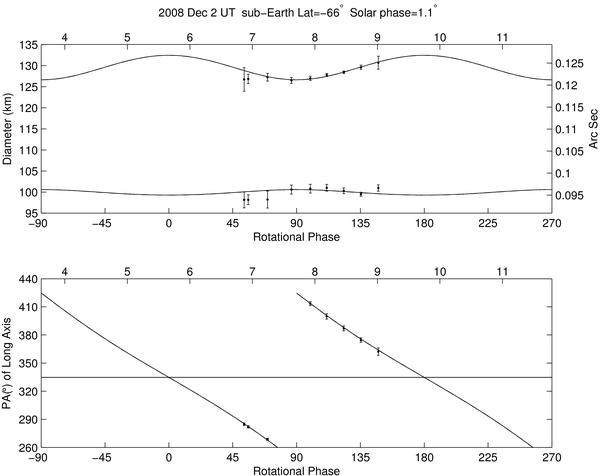
Triaxial ellipsoid fit to measured ellipse parameters of (21) Lutetia on 2008 December 2. In the upper subplot, each image’s apparent long (α) and short (β) axis dimensions are plotted as dots with 1σ uncertainties. The lines are the prediction for the projected ellipses from the triaxial ellipsoid parameters in Table 3, derived from the fit to the data. Because the solar phase angle (ω) is only 1.1° (Fig. 2 and Table 1), the ellipse parameters for the terminator ellipse is coincident with the projected ellipse lines. The lower subplot shows the same for the position angle of the long axis, where the horizontal line is the line of nodes, the intersection of the asteroid’s equator and the plane of the sky. This figure is corrected for light time travel, i.e., the plot is in the body-centered time frame.
Current usage metrics show cumulative count of Article Views (full-text article views including HTML views, PDF and ePub downloads, according to the available data) and Abstracts Views on Vision4Press platform.
Data correspond to usage on the plateform after 2015. The current usage metrics is available 48-96 hours after online publication and is updated daily on week days.
Initial download of the metrics may take a while.