Fig. 2
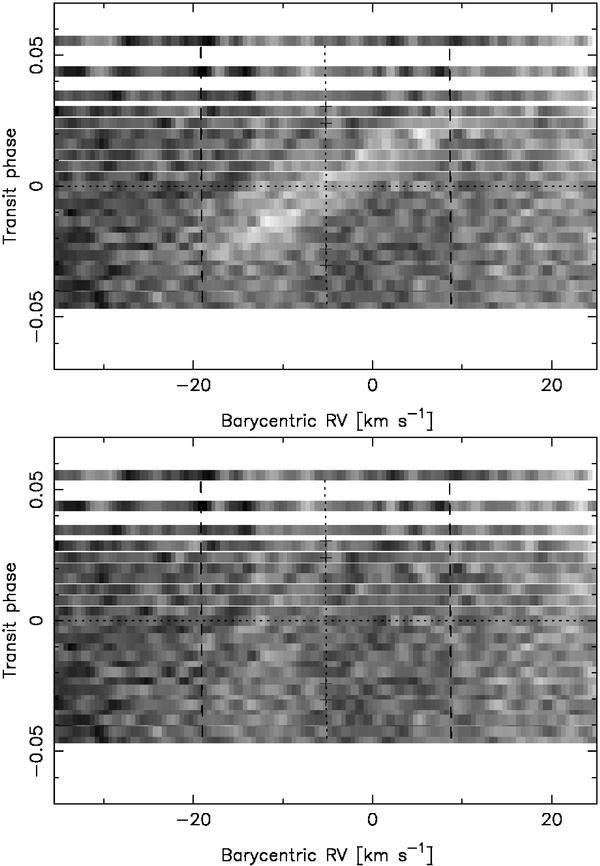
Top: residual map of time series CCFs with the model spectrum subtracted leaving the bright time-variable feature due the light blocked by the planet. Bottom: here the best-fit model for the time-variable feature has also been removed to show the overall residual. The horizontal dotted line marks the phase of mid-transit. The shift of this line from zero shows the underlying systemic radial velocity. The two vertical dashed lines are at ± vsini from the stellar radial velocity (marked by the vertical dotted line). The crosses on the vertical dotted line denote the two points of contact at both ingress and egress.
Current usage metrics show cumulative count of Article Views (full-text article views including HTML views, PDF and ePub downloads, according to the available data) and Abstracts Views on Vision4Press platform.
Data correspond to usage on the plateform after 2015. The current usage metrics is available 48-96 hours after online publication and is updated daily on week days.
Initial download of the metrics may take a while.