| Issue |
A&A
Volume 523, November-December 2010
|
|
|---|---|---|
| Article Number | A9 | |
| Number of page(s) | 11 | |
| Section | Extragalactic astronomy | |
| DOI | https://doi.org/10.1051/0004-6361/201015030 | |
| Published online | 10 November 2010 | |
The asymmetric radio structure and record jet of giant quasar 4C 34.47
Kapteyn Astronomical Institute, University of Groningen,
PO Box 800,
9700 AV
Groningen,
The Netherlands
e-mail: [seyit; pdb]@astro.rug.nl
Received:
21
May
2010
Accepted:
10
August
2010
Abstract
Context. Unification models for active galactic nuclei, AGN, predict that all quasars (radio sources associated with quasi-stellar objects) should be at a substantial angle with the sky plane.
Aims. We test the predictions of the orientation unification model with the morphological and polarization properties of a giant quasar.
Methods. The giant double-lobed radio source 4C 34.47, which is associated with quasi-stellar object B1721+343, is mapped at arcsecond scale resolution, and the data are subsequently analyzed within the context of current models for extragalactic radio sources.
Results. Quasar 4C 34.47 displays a straight one-sided jet, measuring a record length of 380 kpc in its double-lobed radio structure. Assuming an intrinsically symmetric two-sided jet structure the radio source jet axis must be at least 33° away from the sky plane, that is within 57° from the line of sight. The radio polarization properties indicate that this giant source has largely outgrown the depolarizing halo that is generally associated with the host galaxies of powerful radio sources. The measured small depolarization asymmetry nevertheless agrees with its inferred orientation.
Conclusions. All data for this giant radio source agree with its preferred orientation as predicted within the unification scheme for powerful radio sources. Seen under a small aspect angle the radio source is large, but not excessively large. The global properties of 4C 34.47 do not differ from other giant (old) FR2 radio sources: it is a slowly expanding low-luminosity radio source.
Key words: galaxies: active / quasars: individual: 4C 34.47
© ESO, 2010
1. Introduction
Quasars were discovered in the 1960s by virtue of their radio emission. While this emission later proved to be the exception rather than the rule, the radio sources associated with quasi-stellar objects have generated great interest over the past decades. With ever increasing angular resolution (including Very-Long Baseline Interferometry, VLBI), the study of extragalactic radio sources – quasars and radio galaxies – led to our understanding of the relevant processes, whereby the ultimate energy source in these objects must be located in their nuclei, on the subparsec scale, and whereby jets transport some part of this energy to radio-emitting lobes in intra- or intergalactic space. Indeed, the study of extragalactic radio sources and the subsequent need for increasing angular resolution provided the stimulus to develop VLBI techniques.
Fine reviews of the morphologies and other properties of extragalactic radio sources can be found e.g. in Miley (1980), Bridle & Perley (1984), Saikia & Salter (1988), Carilli & Barthel (1996), and Zensus (1997). The radio morphologies of quasars can be broadly classified into two categories: core-dominated or lobe-dominated. Examination of the detailed properties of these two classes, incorporating properties in other wavelength regimes, has led to the notion that the orientation of the radio jets with respect to the observer is the prime discriminant. Core-dominated objects typically display one short (curved) jet and relatively weak halo-emission besides the dominant core (coincident with the actual QSO), whereas the morphologies of lobe-dominated (i.e., Fanaroff & Riley Class 2, FR2) objects comprise extended double lobes that straddle the QSO radio core. Only single-sided jets are observed, in either classes. This jet asymmetry together with the occurrence and the magnitude of the milliarcsec scale proper motion measured in the jet components led to the picture that radio-loud quasars are preferably oriented objects, with the lobe-dominated objects at substantial angles to the line-of-sight, and the core-dominated objects at small angles to that line. Projection, foreshortening, and relativistic effects are naturally invoked to explain the observed radio properties of the compact subclass, including the frequently observed superluminal motion (e.g., Orr & Browne 1982). The combined properties of the radio-loud QSO class together imply however that quasars in or close to the plane of the sky simply do not exist: these objects must masquerade as another class of object, namely extended double-lobed FR2 radio galaxies. Following the spectropolarimetric detection of an obscured quasar in radio galaxy 3C 234 (Antonucci 1984), this unified picture for powerful extragalactic radio sources was initially explored by Scheuer (1987) and Peacock (1987), and was subsequently put on a firm basis by Barthel (1989). An optically opaque “torus”1 surrounding the central accretion disk in its equatorial plane, blocking the view towards the accretion disk and its associated broad line region, is an essential ingredient of these unification models. Relevant reviews of the quasar – radio galaxy as well as complementary unification theories can be found in Antonucci (1993), Urry & Padovani (1995), and Maiolino et al. (2002). We stress that a complete explanation of extragalactic radio sources should obviously also take into account the effects of radio source evolution (youth-adulthood-seniority), radio source environment, and activity duty cycle, besides the aspect-dependent effects.
Their asymmetric radio depolarization (“depolarization asymmetry”) provided independent support for the preferred orientation of the quasar class. Following up on radio galaxy depolarization studies by e.g., Strom & Jaegers (1988), Laing (1988) and Garrington et al. (1988) first drew attention to the fact that the “jetted” lobes in quasars display less depolarization (with increasing wavelength) than the unjetted lobes. They suggested that this effect was owing to natural line-of-sight depolarization effects towards a near lobe with approaching jet and a distant lobe with receding jet, through an extended, Faraday-thick, magneto-ionic halo hosting the radio source. The effect appeared to be strong in small radio sources, but virtually absent in large ones (Garrington & Conway 1991).
Extensive radio-imaging studies by e.g., Hough & Readhead (1989), Hough et al. (1999), Bridle et al. (1994), Fernini et al. (1993, 1997), Dennett-Thorpe et al. (1997, 1999) and most recently Mullin et al. (2008) have yielded broad agreement with the orientation-dependent unification scheme, but the abovementioned studies also found evidence for radio source environmental effects. Consistency with aspect-dependent unification was also found in optical and infrared studies of the AGN and their host galaxies (e.g., Ogle et al. 1997; Dunlop et al. 2003; Haas et al. 2004, 2005). Open issues obviously remain, such as the torus opening angle (e.g., Grimes et al. 2004), the nature of the class of broad line radio galaxies (e.g., Dennett-Thorpe et al. 2000; van Bemmel & Barthel 2001), and the nature of low excitation radio galaxies, LERGs (e.g., Hardcastle 2004) as well as mid-infrared weak radio galaxies (e.g., Ogle et al. 2006; van der Wolk et al. 2010).
For more than a decade, the 4-arcmin radio source 4C 34.47, associated with the z = 0.206 QSO 1721+343 (B1950), was known as the largest quasar (Conway et al. 1977; Jägers et al. 1982). Using a flat cosmology, with H0 = 73 and Ωm = 0.272, its projected linear size is 0.84 Mpc (the scaling factor is 3.25 kpc/arcsec). That size record was taken over in 1989 by 4C 74.26 (Riley et al. 1989), measuring 1.1 Mpc. With a projected dimension of 2.3 Mpc, WENSS B 0750+434 is the current record holder, although its discoverers (Schoenmakers et al. 2001) did not seem to be aware that their giant quasar is substantially larger than the then current record holder HE 1127 − 1304 (Bhatnagar et al. 1998).
With the aim to study the detailed properties of 4C 34.47, a series of multi-frequency Very Large Array (VLA) observations was conducted in the mid 1980-s (co-I’s Barthel, van Breugel, Jägers). Some initial radio images were obtained and published (Barthel 1987), but the full analysis of the radio morphological, spectral, and polarization properties was never completed. In the meantime, the bright radio core of 4C 34.47 was targeted by successive series of VLBI observations, from 1980 onwards (van Breugel et al. 1981; Barthel et al. 1985, 1989; Hooimeyer et al. 1992). The detection of superluminal motion in the core of this giant radio source (Barthel et al. 1989) obviously provided substantial support for the preferred orientation of the radio-loud quasar class.
Because the book is not closed on this remarkable object and given the renewed interest in giant sources within both radio source unification and evolution models (e.g., Ishwara-Chandra & Saikia 1999; Machalski & Jamrozy 2006) we decided to reexamine the original VLA data. Do its large-scale radio properties agree with the proposition that 4C 34.47 – despite its giant projected dimension – is oriented relatively close to the line of sight, as inferred from its nuclear radio properties? This is the prime question we address here.
2. Observations, data reduction, and imaging
2.1. Observations
Radio observations of 4C 34.47 have been made with the VLA using its C-band (6 cm) and L-band (20 cm) and at three different array configurations, yielding four data sets: two different resolutions at two different wavelengths. All data were taken in 1984 by Barthel and Van Breugel. Typical resolution parameters are listed in Table 1.
Typical VLA resolutions θHPBW in arcseconds, in the current project.
On-source integration times for the observations are in the range of 1.5 to 3 h for each configuration/band combination. Ten to 20 min scans on 4C 34.47 covering a range of hour angles were interspersed with short observations of nearby phase and amplitude calibrator B1732+389. The source 3C 286 served as absolute amplitude calibrator and also to correct for the phase difference of right and left polarization. Coordinates of the radio sources are shown in Table 2. Two intermediate frequencies (IFs) with bandwidths ranging from 12.5 MHz to 50 MHz were used. The detailed observing parameters are listed in Table 3.
Positions of the target and calibration sources in 1950 (FK4) coordinates.
Observation details for the different configurations.
2.2. Data reduction
The array performed well: judged from the calibration sources, the antenna phase, amplitude, and polarization calibration appeared stable to within a few percent. The radio data were of high quality, and there was no need for extensive flagging of discrepant points. Reduction of the data was performed with standard NRAO AIPS image processing routines, including several steps of self-calibration (phase only, followed by amplitude self-calibration). Several successive self-calibration and cleaning cycles with varying amplitude-gain factors generally led to a rapid convergence toward the final images. In order to uncover the weak diffuse emission, the final deep cleaning steps involve well over 100 000 iterations.
Multi-resolution images were obtained by combining uv-datasets. However, 4C 34.47 is known to have a (strong) variable radio core. Hence the multi-resolution images involve subtraction of the cores in both data sets, with subsequent calibrating, imaging, and cleaning of the concatenated data set, and restoration of a core in the resulting multi-resolution image.
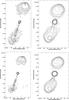 |
Fig. 1 Contour plots of the four images. The contour levels are rms (Table 4 × 3, 6, 9, 12, 18, 24, 48, 96, 192 mJy Beam-1. Top left: high-resolution 20 cm image (LB). Top right: low-resolution 20 cm image (LC). Bottom left: high-resolution 6 cm image (CC). Bottom right: low-resolution 6 cm image (CD). |
3. Results
3.1. High- and low-resolution images: a record jet in a low-luminosity radio source
The final total intensity images are shown in Fig. 1. A codename (band+array) is given to each image cf. Table 3. The high-resolution images (LB and CC) show details of the jets, while in the relatively low-resolution images (LC and CD) the diffuse lobe structures are better seen. The source 4C 34.47 has a remarkably bright core, unlike typical double-lobed 3CR quasars, whose cores generally contribute ≲ 10% of the total 6 or 20 cm flux density (e.g., Bridle et al. 1994). Table 4 summarizes the resulting imaging figures. While the theoretical noise was not reached, acceptable figures were obtained. The resulting angular resolution is ~4″ and ~12″ respectively, cf. expectation. Given that the overall source angular size is just over 4′, primary beam corrections are not necessary (the VLA 6 cm primary beam width
 ).
).
Observational parameters.
The images show that both hot spots and the core are well aligned, to better than 1°. The high-resolution 6 cm image (CC) displays a beautiful straight one-sided jet, which stretches almost continously from the core to the southern hot spot – a (projected; see Sect. 4.4) distance of 380 kpc. To our best knowledge, the jet in 4C 34.47 is the record longest straight quasar jet3. Even at relativistic speeds, the particle travel time from core to southern hot spot well exceeds one million years. This southern hot spot is more compact than the northern one; it is also more distant from the core than the northern one is. No counterjet (towards the northern lobe) is seen. As alluded to already, the intensity of the core is high: its relative contribution is ~35% of the 20 cm and ~58% of the 6 cm total intensity. Its spectral index
 (Sν ∝ να). From the low-resolution data we infer a total 1.4 GHz flux density of 1.4 Jy; taking out the probably relativistically boosted core emission then yields a 1.4 GHz integrated radio source luminosity of 1.1 × 1026 W/Hz. With reference to Fernini et al. (1991), we note the resemblance of 4C 34.47 to FR2 quasar 3C 47, concerning their overall radio morphologies and the knot structure in their one-sided jets (but we keep in mind that the latter is roughly a factor twenty more radio-luminous than the former).
4C 34.47 core strength comparison.
3.2. Multi-resolution combined images
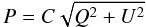
Images at the same frequency but with different resolutions can be combined to obtain a multi-resolution image. These then show both the detailed features of the high-resolution and the low-surface brightness features of the low-resolution image. Employing core subtraction as described above, we obtained such images at 20 cm and at 6 cm; these are shown in Fig. 2 (LB+LC) and Fig. 3 (CC+CD), respectively. A fixed circular clean beam of 7″̣5 was adopted to facilitate the comparison of the images, including the radio spectral behavior. The images reach noise levels of ~0.12 and ~0.06 mJy/beam respectively.
The straight jet stands out nicely in the 6 cm image. It displays a number of knots and connects to the more distant of the two hot spots, cq. radio lobes. No counter-jet is observed.
3.3. Core variability
The variability of the radio core is remarkable. We compare the measured 1984 core strength with earlier measurements made with the Westerbork Synthesis Radio Telescope (WSRT), in 1973/74 (Conway et al. 1977) and in 1974/79 (Jägers et al. 1982). The results are summarized in Table 5. The data indicate a ~15% decrease in ten years at 1.4 GHz, and ~25% at 5 GHz. We note that the associated optical QSO 1721+343 was also found to be variable (McGimsey & Miller 1978). Relativistic beaming effects, invoked to explain the measured superluminal motion (Barthel et al. 1989; Hooimeyer et al. 1992), provide a natural explanation for the behavior of the (non-thermal) core emission.
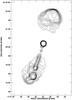 |
Fig. 2 Combined 1.4 GHz image of two different resolution maps, LB and LC (see Fig. 1). The FWHM of the clean beam was fixed at 7″̣5. Contour levels are 0.25 × 4, 6, 8, 10, 12, 14, 16, 18, 20, 25, 30, 40, 80, 160, 320 mJy/beam. The peak flux density is 487.7 mJy/beam. |
3.4. Spectral index behavior
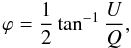
Figure 4 presents the spectral index map (
 ) for 4C 34.47, taken from its high-resolution images, with capital letters marking positions of interest. Both hot spots (positions A and I) display steep emission, with values −0.86 and −0.88, respectively. Lobe emission is also steep, although not extreme: we measure indices −0.77 and −0.84 at locations B and H. As alluded to before, the core (C) has a fairly flat index −0.29; jet knots display values between −0.42 to −0.79 (D to G). The spectral index error is estimated to be ±0.05 at most. A summary of the measurements is given in the table above the spectral index map.
When comparing the measured spectral indices with the values obtained by Jägers et al. (1982), which are ~−0.75 at the hot spots and ~−0.25 in the center, we see that they agree well. Only slight differences exist, which can be explained by their larger spectral range (0.6 GHz to 5 GHz) and by core variability (their core spectral index is flatter).
3.5. Polarization properties
The polarization properties of 4C 34.47 were examined by analyzing the polarized intensity, degree of linear polarization, and polarization angle maps of the radio source. These maps were obtained by combining I, Q, and U images, which describe the polarization parameters P (polarized intensity), ΠL (polarization percentage), and ϕ (polarization angle (E-vector)), according to Eqs. (
1) through (3):
 (1)
(1)
 (2)
(2)
 (3)where the factor C is a noise-based correction for Ricean bias. Figures 5 and 6 present the polarization data for both IFs at both frequencies in the low-resolution (14″) configuration, superposed on total intensity images.
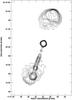 |
Fig. 3 Combined 5 GHz image of two different resolution maps, CC and CD (see Fig. 1). The FWHM of the clean beam was fixed at 7″̣5. Contour levels are 0.109 × 4, 6, 8, 10, 12, 14, 16, 18, 20, 25, 30, 40, 80, 160, 320 mJy/beam. The peak flux density is 337.2 mJy/beam. |
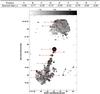 |
Fig. 4 Gray scale representation of the spectral index between 1.4 and 5 GHz with superimposed contours of total intensity. The measurements at the marked locations are summarized in the table. |
Substantial Faraday rotation is seen between the L-band and the C-band data, the nature of which will be discussed below. Both the polarized intensity (Fig. 5) and the polarization percentage, P/I (Fig. 6) are shown. Little depolarization is seen. We measure typical polarization percentage values of ~10%–20% in the jet and inner lobe regions, at both frequencies. The lobe edges, particularly in the southern lobe, display polarization percentages ~25%–40%. Assuming that the polarization vectors at C-band trace the source intrinsic fields (see below), the well ordered magnetic fields follow the edges of the lobes. Intricate field structure is seen in the inner lobe regions. The jet magnetic field is parallel to the flow, but experiences a sudden turn in the bright jet knot, 30″ (100 kpc) before the southern hot spot. This is also seen in the high-resolution C-band polarization image (not shown here).
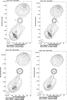 |
Fig. 5 Contour map of the total intensity with polarization intensity and E-vectors overlaid at different frequencies. Top left: 1452.4 MHz; top right: 1502.4 MHz; bottom left 4885.1 MHz; bottom right 4835.1 MHz. |
RM values at specific locations.
 |
Fig. 6 Contour map of the total intensity with linear polarization degree and E-vectors overlaid at different frequencies. Top left: 1452.4 MHz; top right: 1502.4 MHz; bottom left 4885.1 MHz; bottom right 4835.1 MHz. |
As can be readily seen, the 1.4 GHz and 5 GHz images display roughly π/2 radians rotation. However, that rotation is nπ ambiguous. In order to assess the magnitude and origin of the Faraday rotation, we therefore used the two separate 1.4524 and 1.5024 GHz IFs and the 5 GHz data. These frequencies permit an unambigous fit of rotation measure, RM, values, using
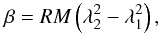 (4)where β is the measured angle of rotation. The RM values inferred from these fits at various locations (see Fig. 4) are listed in Table 6. The southern hot spot value implies a rotation at that position of ~6° between the two 1.4 GHz IFs – a value that can indeed be seen in the relevant images. At 5 GHz, the rotation between the two IFs is reduced to ~1°. This implies that the measured angles of polarization at 5 GHz trace the source-intrinsic magnetic fields. The source-integrated Faraday rotation measure is 41.4 rad m-2. This translates to a Faraday rotation of 92°̣1, from 20 cm to 6 cm observing wavelength. Because the rotation is roughly constant, most of it must be attributed to the Galactic foreground. The RM value of 4C 34.47 is moreover in line with values for nearby objects (Simard-Normandin & Kronberg 1980).
If the Faraday-rotating medium is located between the source and the observer, then the only effect is a net rotation of the plane of polarization. However, if the Faraday-rotating medium is mixed up with the emitting region, then radiation emitted from different depths and from different sight lines within the observing beam is rotated by different amounts, thus reducing the net polarization over extended areas.
In order to assess the nature of the (small) Faraday depolarization, particularly in the light of the depolarization asymmetry discussed in Sect. 1, we have measured it at twelve different areas of the radio source. Eight of the selected locations are chosen to be large areas, because larger areas will give more averaging and therefore more accurate results. We have also determined the depolarization in the hotspots, in the core, and in the southern tip of the northern lobe (the closest location to the core on the north side with reliable P/I detections). The DP value is the ratio of P/I at 5 GHz and P/I at 1.4 GHz. Values higher than unity imply depolarization; values lower than unity indicate re-polarization. The measurements are given in Table 7.
DP values at different locations.
As can be readily seen, hardly any significant depolarization is measured: except for the core and the lobe emission just north of the core, all values are unity within the measurement errors. This is a remarkable result, suggesting that little ionized gas is mixed in with the radio plasma and that little or no depolarizing medium is present around the giant radio source.
4. Discussion
4.1. Orientation of the radio jet
By measuring the jet-to-counterjet flux density ratio and knowing the bulk flow velocity in the jets, the object’s angle θ w.r.t. its line of sight can be recovered, assuming an intrinsically symmetric object experiencing Doppler boosting, which results in its asymmetric appearance. Following Scheuer & Readhead (1979), this phenomenon can be quantified using Eq. (5):
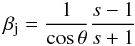
![Mathematical equation: \begin{equation} \frac {S\!_{j}} {S\!_{cj}} = \left[ \frac {1 + \beta_{\rm j} \cos\theta} {1 - \beta_{\rm j} \cos\theta} \right]^{2-\alpha}, \label{eq:sidedness} \end{equation}](/articles/aa/full_html/2010/15/aa15030-10/aa15030-10-eq58.png) (5)where βj is the velocity of the jet in units of c and α the jet spectral index. If on the other hand the angle is known but the velocity needs to be recovered, Eq. (5) can be rewritten in the form for β cf. Eq. (6). Equation (7) gives the corresponding Lorentz factor.
(5)where βj is the velocity of the jet in units of c and α the jet spectral index. If on the other hand the angle is known but the velocity needs to be recovered, Eq. (5) can be rewritten in the form for β cf. Eq. (6). Equation (7) gives the corresponding Lorentz factor.
 (6)
(6)
![Mathematical equation: \begin{equation} \gamma = 1 / \left\lbrace 1 - (1/\cos^{2}\theta)[(s - 1)/(s + 1)]^{2} \right\rbrace^{\frac {1} {2}}, \label{eq:sidedness3} \end{equation}](/articles/aa/full_html/2010/15/aa15030-10/aa15030-10-eq62.png) (7)where s =
(7)where s =
 .
.
The average jet spectral index obtained from the results in Fig. 4 is −0.6. The high-resolution 5 GHz image indicates a lower limit for the jet-counterjet ratio of Sj/Scj = 24.0, with a sigma of 2.9. Rewriting Eq. (6) yields an upper limit to the angle θ:
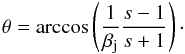 (8)Hence, assuming an intrinsically symmetric radio source, we infer that the angle to the line of sight of 4C 34.47 cannot be larger than 57° (for βj = 1). This upper limit is not very sensitive to the value of the jet spectral index α. The actual bulk flow speed in the jet must be slower than the speed of light. Moreover, the flux density of the approaching jet is taken as an average over the whole jet and since the counterjet is not detected at all, the maximum flux at any point on the approaching jet could also have been used to get the ratio. This would have resulted in a higher limit to the flux density ratio. The dependence of the flow velocity on the angle at the adopted ratio of 24 is presented in Fig. 7. For reasonably relativistic speeds (≥0.9c), this implies that for the adopted ratio, the range of the angle is 4°, i.e., between 53° and 57°. The lower limit of 53° is obviously not strict: a higher value for the jet-counterjet ratio is quite plausible, and therefore a smaller aspect angle.
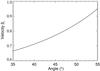 |
Fig. 7 Dependence of the jet bulk flow velocity on the aspect angle, adopting a flux density ratio Sj/Scj = 24 and jet spectral index −0.6. |
4.2. Foreground Faraday rotation
Given the roughly constant rotation of about 90° over all components of the radio source, the Faraday rotation toward 4C 34.47 must be mainly due to our own Galaxy. Yet the rotation is not entirely uniform over the whole source. As judged from Table 6, it ranges between 80° to 100°. Leahy (1987), analyzing foreground RM behavior on size scales of tens of arcseconds, finds that RM variations for sources within 10° of the galactic plane are ≈20 rad m-2, while these variations are ≈6 rad m-2 for sources near the galactic pole. The galactic latitude of 4C 34.47 is 32°̣2. Given that they occur on size scales as small as 20″, the 4C 34.47 RM standard deviation values (Table 6) are in line with the Leahy (1987) measurements.
4.3. Depolarization and its asymmetry
As presented in Sect. 3.5, there is hardly any measurable depolarization between 6 and 20 cm, except toward the core and the southern tip of the northern lobe (about 175 pc north of the core). The source 4C 34.47 is very large and these depolarization results are therefore not entirely unexpected. Garrington et al. (1991) and Garrington & Conway (1991) compare the polarization properties of 47 double radio sources with half of them having angular dimensions in excess of ~30″, and establish a significant depolarization asymmetry for the small sources, but not for the large ones.
As Garrington & Conway (1991) show, the medium responsible for the asymmetry is not likely to be hot ISM gas, but rather the IGM, because the differences in RM between lobes do not correlate with the Faraday dispersion factor Δ – see Eq. (9)
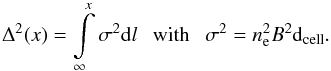 (9)From X-ray observations, the presence of a halo of hot gas has been revealed around many galaxies, and this is most likely the dominant agent causing depolarization (which is generally observed in extragalactic radio sources – e.g., Strom & Jaegers 1988). Within the halo gas model, depolarization asymmetry is easily explained by the orientation of the source, relating the visibility of a relativistic jet to its approaching nature and the non-visibility of a (counter)jet to its receding nature.
Besides the orientation of the object, the size of this halo of hot gas compared to the radio source size determines the magnitude of the depolarization asymmetry. The largest asymmetry should occur at the edges of the radio source, provided the overall source is still well contained within the hot gas halo. The source 4C 34.37 obviously violates this requirement. Indeed, Garrington & Conway (1991) conclude from their analysis that the typical halo core diameter must be about 100 kpc.
We therefore conclude that 4C 34.47 has largely outgrown its depolarizing halo, but note with interest that the only occurrence of significant off-nuclear depolarization is at the invisible counterjet-side, cf. standard predictions. It would be interesting to study the depolarization properties at decimeter wavelengths with sufficient resolution and sensitivity. A dedicated VLA or LOFAR (LOw Frequency ARray) project would be required for this purpose.
It should be noted also that the pure orientation explanation for the depolarization behavior is too simplistic. The effects of host galaxy environment as well as redshift were proven to play a role (Liu & Pooley 1991a,b; Dennett-Thorpe et al. 1997, 1999; Goodlet & Kaiser 2005). An in-depth study by Fernini (2001) found no convincing differences of depolarization-ratios between classes of large radio galaxies and quasars. On the basis of its depolarization properties, 4C 34.47 nevertheless fits the picture of an inclined radio source with its northern lobe directed away from us.
4.4. The orientation of 4C 34.47
As discussed above, its strong one-sided jet together with its polarization properties argue for an aspect angle value of the 4C 34.47 radio source axis, θ ≪ 90°. A fairly simplistic treatment of the jet-counterjet ratio permits us to determine an upper limit to the inclination angle w.r.t. the sight line of θ < 57°, or θ ≪ 57°. That constraint would be largely consistent with the θ ≲ 45° restriction for quasars within the quasar – radio galaxy unification model (Barthel 1989).
How does this orientation of the large scale radio source compare to the orientation of the milliarcsec scale radio jet in its bright radio core? For this jet, Barthel et al. (1989) and Hooimeyer et al. (1992) report a knot proper-motion of 0.29 milliarcsec/year. This value translates to a projected expansion speed of 3.9c, using the here adopted cosmology, and that apparent superluminal motion implies a maximum allowable inclination4 of 29°, within the framework of the standard model for superluminal motion (Pearson & Zensus 1987). A source aspect angle θ = 14° would minimize the requirement on the relativistic bulk flow speed, γ, in the small scale jet jet to γ ≧ 3.9, in order to explain the observed superluminal motion. These angles would however suggest jet-counterjet flux ratios at least one order of magnitude higher than the lower limit measured above.
There is no a priori reason that the small scale jet should have exactly the same inclination as the large scale jet. Indeed, Barthel et al. (1989) noted a projected misalignment angle of 5° between the large and the small scale jets in 4C 34.47. The inferred small scale aspect angles of 29° and 14° nevertheless would imply deprojection factors 1/sinθ = 2.0 and 4.1 respectively, whereas the large scale limit θ ≲ 57° would suggest a factor of at least 1.2. These factors indicate a physical size of 4C 34.47 in the range 1.0–3.4 Mpc. This is large, but not excessively large. Long-time record holder radio galaxy 3C 236, measuring 4.3 Mpc, was recently overtaken by J1420−0545, with a projected size of 4.6 Mpc (Machalski et al. 2008). With reference to e.g., Ishwara-Chandra & Saikia (1999) and the introductory section, double-lobed radio sources associated with QSOs have projected sizes up to ≈1.2 Mpc, with the occasional outlier at 2 Mpc, whereas radio galaxies reach up to ≈2.5 Mpc, with the occasional outlier at 4 Mpc. Even seen under a small angle, 4C 34.47 is not uncomfortably large. That small aspect angle finds additional support in the fact that the broad-emission line region in the associated QSO B1721+343 is probably seen face-on (Miley & Miller 1979; Wills & Browne 1986), and in the variable nature of its bright core, as discussed above.
On the assumption of a symmetric radio source, with the same intrinsic core-to-hotspot distances north and south, the approaching southern hotspot should have a larger projected distance from the core than the receding northern one, because of the light travel-time difference. This is indeed the case: the measured difference is 19 kpc projected distance. Irregardless of the exact inclination of the radio source, that difference can only be modeled adopting a fairly slow hotspot advance speed, ≈0.02c−0.04c. These speeds are indeed typical for the class of low luminosity FR2 radio sources (Alexander & Leahy 1987), to which 4C 34.47 belongs, and are furthermore consistent with the absence of a significant difference in hotspot spectral index (e.g., Ishwara-Chandra & Saikia 2000).
4.5. Giant among giants ...
How does giant quasar 4C 34.47 compare to other giant radio sources? Giant radio sources are loosely defined to have a projected dimension in excess of 1 Mpc (by fans of an H0 = 50 cosmology). With the current cosmology standard, 4C 34.47 has a projected size of 0.84 Mpc. As discussed in the previous section, it definitely classifies among the very large radio sources associated with QSOs, and we note in passing that the size distributions of the giant radio sources as mentioned briefly in the previous section are consistent with predictions from the standard quasar – radio galaxy unification model. The quasars, including the giants and obviously 4C 34.47, stand out with higher core fractions, which is also cf. unification and beaming predictions (e.g., Hough & Readhead 1989; Ishwara-Chandra & Saikia 2000).
Giant radio sources generally have relatively low radio luminosities. A P–D diagram (power-size) comparing giant radio sources with the overall extragalactic 3CR population was shown by Ishwara-Chandra & Saikia (1999). The deficit of large, high-power objects is generally explained as due to the effects of aging, whereby lobes in old radio sources have lost substantial fractions of their radio power through expansion, inverse Compton, and radiative losses. The source 4C 34.47, with a 1.4 GHz radio luminosity of just over 1 × 1026 W/Hz (see Sect. 3.1), fits that model. Large radio lobe volumes emitting weakly suffer from relatively high inverse Compton losses (to the redshifted cosmic background). These losses dominate also for 4C 34.47 over the source intrinsic radiation losses. Because inverse Compton losses limit the age of the radio source, giant radio sources such as 4C 34.47 are believed to be rare at high redshift, where the inverse Compton losses are excessive.
5. Conclusions
We presented sensitive, detailed, dual-frequency, multi-resolution images of the large double-lobed radio source 4C 34.47 associated with the z = 0.206 QSO B1721+343 obtained with the VLA. The radio structural as well as radio spectral and polarization properties of this giant radio source were studied. A prominent one-sided jet of record length was discovered. This jet, together with the bright, variable radio core, provides support for the picture whereby the axis of radio source is substantially offset from the sky plane, despite the large projected size of the overall source. As such, the VLA imaging supports the preferred orientation of the radio source, as indicated earlier from the superluminal jet observed in its radio core. The measured large scale radio (de)polarization properties do not contradict this picture, but suggest also that 4C 34.47 has largely outgrown its magnetoionic halo, again cf. expectation. The source 4C 34.47 is a slowly expanding, old FR2 radio source, with its jet axis seen under a small aspect angle causing relativistic beaming phenomena to be observed. Otherwise, 4C 34.47 is not different from other giant radio sources oriented differently.
At least a dust configuration covering a substantial solid angle.
Values used throughout.
Longer (but often fainter and curved or twisted) jets have been imaged in radio galaxies, such as NGC 315 and HB 13 (Jaegers 1987), and CGCG 049 − 033 (Bagchi et al. 2007).
Barthel et al. (1989) determined a maximum allowable angle of 44° for 4C 34.47, using a different cosmological model.
Acknowledgments
The authors acknowledge careful reading by the referee. S.H. acknowledges expert advice from Robert Laing and Richard Strom, during their visits to the Kapteyn Astronomical Institute. P.D.B. acknowledges the NRAO VLA staff for expert observing and assistance in data handling and Wil van Breugel for his early interest in this project. Dr J. Baghi kindly updated the authors concerning the jet in CGCG 049-033. The National Radio Astronomy Observatory is a facility of the National Science Foundation operated under cooperative agreement by Associated Universities, Inc.
References
- Alexander, P., & Leahy, J. P. 1987, MNRAS, 225, 1 [NASA ADS] [CrossRef] [Google Scholar]
- Antonucci, R. 1993, ARA&A, 31, 473 [Google Scholar]
- Antonucci, R. R. J. 1984, ApJ, 278, 499 [NASA ADS] [CrossRef] [Google Scholar]
- Bagchi, J., Gopal-Krishna, Krause, M., & Joshi, S. 2007, ApJ, 670, L85 [NASA ADS] [CrossRef] [Google Scholar]
- Barthel, P. D. 1987, in Superluminal Radio Sources, ed. J. A. Zensus, & T. J. Pearson, 148 [Google Scholar]
- Barthel, P. D. 1989, ApJ, 336, 606 [Google Scholar]
- Barthel, P. D., Miley, G. K., Schilizzi, R. T., & Preuss, E. 1985, A&A, 151, 131 [NASA ADS] [Google Scholar]
- Barthel, P. D., Hooimeyer, J. R., Schilizzi, R. T., Miley, G. K., & Preuss, E. 1989, ApJ, 336, 601 [NASA ADS] [CrossRef] [Google Scholar]
- Bhatnagar, S., Krishna, G., & Wisotzki, L. 1998, MNRAS, 299, L25 [NASA ADS] [CrossRef] [Google Scholar]
- Bridle, A. H., Hough, D. H., Lonsdale, C. J., Burns, J. O., & Laing, R. A. 1994, AJ, 108, 766 [NASA ADS] [CrossRef] [Google Scholar]
- Bridle, A. H., & Perley, R. A. 1984, ARA&A, 22, 319 [NASA ADS] [CrossRef] [Google Scholar]
- Carilli, C. L., & Barthel, P. D. 1996, A&ARv, 7, 1 [NASA ADS] [CrossRef] [EDP Sciences] [Google Scholar]
- Conway, R. G., Burn, B. J., & Vallée, J. P. 1977, A&AS, 27, 155 [Google Scholar]
- Dennett-Thorpe, J., Bridle, A. H., Scheuer, P. A. G., Laing, R. A., & Leahy, J. P. 1997, MNRAS, 289, 753 [NASA ADS] [Google Scholar]
- Dennett-Thorpe, J., Bridle, A. H., Laing, R. A., & Scheuer, P. A. G. 1999, MNRAS, 304, 271 [NASA ADS] [CrossRef] [Google Scholar]
- Dennett-Thorpe, J., Barthel, P. D., & van Bemmel, I. M. 2000, A&A, 364, 501 [NASA ADS] [Google Scholar]
- Dunlop, J. S., McLure, R. J., Kukula, M. J., et al. 2003, MNRAS, 340, 1095 [NASA ADS] [CrossRef] [Google Scholar]
- Fernini, I. 2001, AJ, 122, 83 [NASA ADS] [CrossRef] [Google Scholar]
- Fernini, I., Burns, J. O., & Perley, R. A. 1997, AJ, 114, 2292 [NASA ADS] [CrossRef] [Google Scholar]
- Fernini, I., Burns, J. O., Leahy, J. P., & Basart, J. P. 1991, ApJ, 381, 63 [NASA ADS] [CrossRef] [Google Scholar]
- Fernini, I., Burns, J. O., Bridle, A. H., & Perley, R. A. 1993, AJ, 105, 1690 [NASA ADS] [CrossRef] [Google Scholar]
- Garrington, S. T., & Conway, R. G. 1991, MNRAS, 250, 198 [NASA ADS] [Google Scholar]
- Garrington, S. T., Leahy, J. P., Conway, R. G., & Laing, R. A. 1988, Nature, 331, 147 [NASA ADS] [CrossRef] [Google Scholar]
- Garrington, S. T., Conway, R. G., & Leahy, J. P. 1991, MNRAS, 250, 171 [NASA ADS] [Google Scholar]
- Goodlet, J. A., & Kaiser, C. R. 2005, MNRAS, 359, 1456 [NASA ADS] [CrossRef] [Google Scholar]
- Grimes, J. A., Rawlings, S., & Willott, C. J. 2004, MNRAS, 349, 503 [NASA ADS] [CrossRef] [Google Scholar]
- Haas, M., Müller, S. A. H., Bertoldi, F., et al. 2004, A&A, 424, 531 [NASA ADS] [CrossRef] [EDP Sciences] [Google Scholar]
- Haas, M., Siebenmorgen, R., Schulz, B., Krügel, E., & Chini, R. 2005, A&A, 442, L39 [NASA ADS] [CrossRef] [EDP Sciences] [Google Scholar]
- Hardcastle, M. J. 2004, A&A, 414, 927 [NASA ADS] [CrossRef] [EDP Sciences] [Google Scholar]
- Hooimeyer, J. R. A., Barthel, P. D., Schilizzi, R. T., & Miley, G. K. 1992, A&A, 261, 1 [NASA ADS] [Google Scholar]
- Hough, D. H., & Readhead, A. C. S. 1989, AJ, 98, 1208 [NASA ADS] [CrossRef] [Google Scholar]
- Hough, D. H., Zensus, J. A., Vermeulen, R. C., et al. 1999, ApJ, 511, 84 [NASA ADS] [CrossRef] [Google Scholar]
- Ishwara-Chandra, C. H., & Saikia, D. J. 1999, MNRAS, 309, 100 [NASA ADS] [CrossRef] [Google Scholar]
- Ishwara-Chandra, C. H., & Saikia, D. J. 2000, MNRAS, 317, 658 [NASA ADS] [CrossRef] [Google Scholar]
- Jaegers, W. J. 1987, A&AS, 71, 75 [Google Scholar]
- Jägers, W. J., Miley, G. K., van Breugel, W. J. M., Schilizzi, R. T., & Conway, R. G. 1982, A&A, 105, 278 [NASA ADS] [Google Scholar]
- Laing, R. A. 1988, Nature, 331, 149 [NASA ADS] [CrossRef] [Google Scholar]
- Leahy, J. P. 1987, MNRAS, 226, 433 [NASA ADS] [Google Scholar]
- Liu, R., & Pooley, G. 1991a, MNRAS, 249, 343 [NASA ADS] [Google Scholar]
- Liu, R., & Pooley, G. 1991b, MNRAS, 253, 669 [NASA ADS] [Google Scholar]
- Machalski, J., & Jamrozy, M. 2006, A&A, 454, 95 [NASA ADS] [CrossRef] [EDP Sciences] [Google Scholar]
- Machalski, J., Kozieł-Wierzbowska, D., Jamrozy, M., & Saikia, D. J. 2008, ApJ, 679, 149 [NASA ADS] [CrossRef] [Google Scholar]
- Maiolino, R., Marconi, A., & Nagar, N. 2002, Issues in Unification of AGN: ASP Conference Series (Astron. Soc. of the Pacific), 258 [Google Scholar]
- McGimsey, B. Q., & Miller, H. R. 1978, A&AS, 31, 147 [Google Scholar]
- Miley, G. 1980, ARA&A, 18, 165 [Google Scholar]
- Miley, G. K., & Miller, J. S. 1979, ApJ, 228, L55 [NASA ADS] [CrossRef] [Google Scholar]
- Mullin, L. M., Riley, J. M., & Hardcastle, M. J. 2008, MNRAS, 390, 595 [NASA ADS] [CrossRef] [Google Scholar]
- Ogle, P., Whysong, D., & Antonucci, R. 2006, ApJ, 647, 161 [NASA ADS] [CrossRef] [Google Scholar]
- Ogle, P. M., Cohen, M. H., Miller, J. S., et al. 1997, ApJ, 482, L37 [NASA ADS] [CrossRef] [Google Scholar]
- Orr, M. J. L., & Browne, I. W. A. 1982, MNRAS, 200, 1067 [NASA ADS] [CrossRef] [Google Scholar]
- Peacock, J. A. 1987, in NATO ASIC Proc. 208: Astrophysical Jets and their Engines, ed. W. Kundt, 185 [Google Scholar]
- Pearson, T. J., & Zensus, J. A. 1987, in Superluminal Radio Sources, ed. J. A. Zensus, & T. J. Pearson, 1 [Google Scholar]
- Riley, J. M., Warner, P. J., Rawlings, S., et al. 1989, MNRAS, 236, 13P [Google Scholar]
- Saikia, D. J., & Salter, C. J. 1988, ARA&A, 26, 93 [NASA ADS] [CrossRef] [Google Scholar]
- Scheuer, P. A. G. 1987, in Superluminal Radio Sources, ed. J. A. Zensus, & T. J. Pearson, 104 [Google Scholar]
- Scheuer, P. A. G., & Readhead, A. C. S. 1979, Nature, 277, 182 [NASA ADS] [CrossRef] [Google Scholar]
- Schoenmakers, A. P., de Bruyn, A. G., Röttgering, H. J. A., & van der Laan, H. 2001, A&A, 374, 861 [NASA ADS] [CrossRef] [EDP Sciences] [Google Scholar]
- Simard-Normandin, M., & Kronberg, P. P. 1980, ApJ, 242, 74 [NASA ADS] [CrossRef] [Google Scholar]
- Strom, R. G., & Jaegers, W. J. 1988, A&A, 194, 79 [NASA ADS] [Google Scholar]
- Urry, C. M., & Padovani, P. 1995, PASP, 107, 803 [NASA ADS] [CrossRef] [Google Scholar]
- van Bemmel, I., & Barthel, P. 2001, A&A, 379, L21 [NASA ADS] [CrossRef] [EDP Sciences] [Google Scholar]
- van Breugel, W. J. M., Schilizzi, R. T., Hummel, E., & Kapahi, V. K. 1981, A&A, 96, 310 [NASA ADS] [Google Scholar]
- van der Wolk, G., Barthel, P. D., Peletier, R. F., & Pel, J. W. 2010, A&A, 511, A64 [NASA ADS] [CrossRef] [EDP Sciences] [Google Scholar]
- Wills, B. J., & Browne, I. W. A. 1986, ApJ, 302, 56 [NASA ADS] [CrossRef] [Google Scholar]
- Zensus, J. A. 1997, ARA&A, 35, 607 [NASA ADS] [CrossRef] [Google Scholar]
All Tables
All Figures
|
Fig. 1 Contour plots of the four images. The contour levels are rms (Table 4 × 3, 6, 9, 12, 18, 24, 48, 96, 192 mJy Beam-1. Top left: high-resolution 20 cm image (LB). Top right: low-resolution 20 cm image (LC). Bottom left: high-resolution 6 cm image (CC). Bottom right: low-resolution 6 cm image (CD). |
| In the text | |
|
Fig. 2 Combined 1.4 GHz image of two different resolution maps, LB and LC (see Fig. 1). The FWHM of the clean beam was fixed at 7″̣5. Contour levels are 0.25 × 4, 6, 8, 10, 12, 14, 16, 18, 20, 25, 30, 40, 80, 160, 320 mJy/beam. The peak flux density is 487.7 mJy/beam. |
| In the text | |
|
Fig. 3 Combined 5 GHz image of two different resolution maps, CC and CD (see Fig. 1). The FWHM of the clean beam was fixed at 7″̣5. Contour levels are 0.109 × 4, 6, 8, 10, 12, 14, 16, 18, 20, 25, 30, 40, 80, 160, 320 mJy/beam. The peak flux density is 337.2 mJy/beam. |
| In the text | |
|
Fig. 4 Gray scale representation of the spectral index between 1.4 and 5 GHz with superimposed contours of total intensity. The measurements at the marked locations are summarized in the table. |
| In the text | |
|
Fig. 5 Contour map of the total intensity with polarization intensity and E-vectors overlaid at different frequencies. Top left: 1452.4 MHz; top right: 1502.4 MHz; bottom left 4885.1 MHz; bottom right 4835.1 MHz. |
| In the text | |
|
Fig. 6 Contour map of the total intensity with linear polarization degree and E-vectors overlaid at different frequencies. Top left: 1452.4 MHz; top right: 1502.4 MHz; bottom left 4885.1 MHz; bottom right 4835.1 MHz. |
| In the text | |
|
Fig. 7 Dependence of the jet bulk flow velocity on the aspect angle, adopting a flux density ratio Sj/Scj = 24 and jet spectral index −0.6. |
| In the text | |
Current usage metrics show cumulative count of Article Views (full-text article views including HTML views, PDF and ePub downloads, according to the available data) and Abstracts Views on Vision4Press platform.
Data correspond to usage on the plateform after 2015. The current usage metrics is available 48-96 hours after online publication and is updated daily on week days.
Initial download of the metrics may take a while.