Free Access
Fig. 2
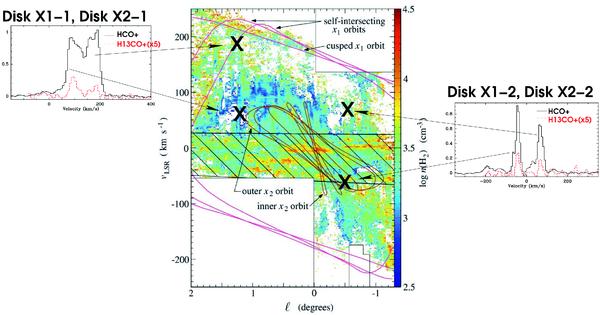
Spectra toward the X1 and X2 orbits in HCO+ and H13CO+ (scaled by a factor of 5). Left: spectra toward the 1.3 complex. Center: l-v diagram showing the X1 and X2 orbits superimposed (Stark et al. 2004). Right: spectra toward Sgr C region.
Current usage metrics show cumulative count of Article Views (full-text article views including HTML views, PDF and ePub downloads, according to the available data) and Abstracts Views on Vision4Press platform.
Data correspond to usage on the plateform after 2015. The current usage metrics is available 48-96 hours after online publication and is updated daily on week days.
Initial download of the metrics may take a while.