Fig. 1
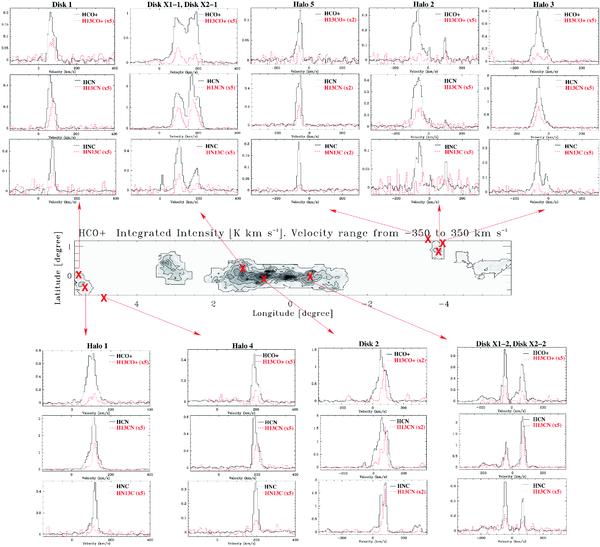
Spectra toward selected positions in the GC in HCO+, H13CO+, HCN, H13CN, HNC, and HN13C. The positions are indicated in the HCO+ integrated intensity map from Riquelme et al. (2010). The main isotope is plotted in black solid line. The 13C isotope is plotted in red dashed line. The 13C substitution is scaled by a factor of 2 or 5 to allow an easy visualization of the spectra. The factor is indicated in each spectrum.
Current usage metrics show cumulative count of Article Views (full-text article views including HTML views, PDF and ePub downloads, according to the available data) and Abstracts Views on Vision4Press platform.
Data correspond to usage on the plateform after 2015. The current usage metrics is available 48-96 hours after online publication and is updated daily on week days.
Initial download of the metrics may take a while.