Fig. 4
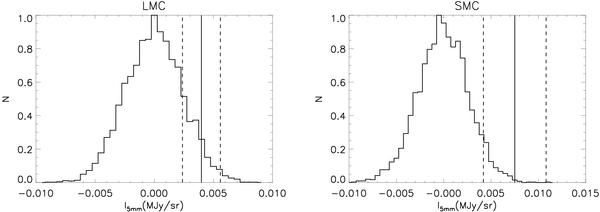
Histogram of the simulated intensity fluctuations of the CMB measured as the fluxes of the LMC and SMC (left and right panels, respectively) at 5 mm (60 GHz), for 5000 random positions on the sky. The histograms have been normalized to their peak value, and the bin size is 5 × 10⁻⁴ MJy/sr). The solid vertical line in each panel corresponds to the measured excess intensity at this wavelength, while the dashed lines give the 3σ error estimates to either side of this measured excess.
Current usage metrics show cumulative count of Article Views (full-text article views including HTML views, PDF and ePub downloads, according to the available data) and Abstracts Views on Vision4Press platform.
Data correspond to usage on the plateform after 2015. The current usage metrics is available 48-96 hours after online publication and is updated daily on week days.
Initial download of the metrics may take a while.