Fig. 3
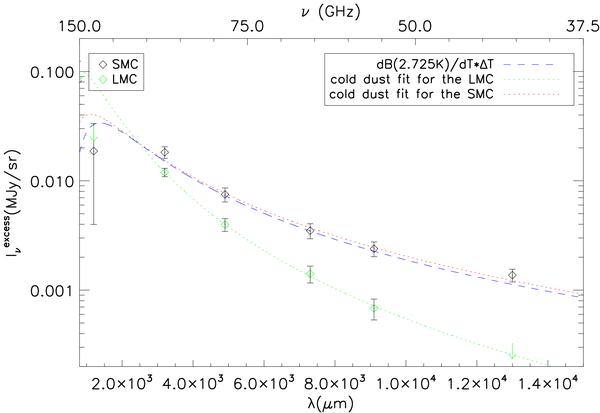
SEDs of the millimeter-centimeter excess in the LMC (in green) and in the SMC (in black). The spectral shape of the CMB fluctuations (dBν(2.725 K) / dT × DeltaTFixsen 2009) is scaled to the SMC excess brightnesses for comparison. Modified black body fits to the LMC and the SMC excess representing a possible cold dust component are shown as dotted lines.
Current usage metrics show cumulative count of Article Views (full-text article views including HTML views, PDF and ePub downloads, according to the available data) and Abstracts Views on Vision4Press platform.
Data correspond to usage on the plateform after 2015. The current usage metrics is available 48-96 hours after online publication and is updated daily on week days.
Initial download of the metrics may take a while.