Fig. 3
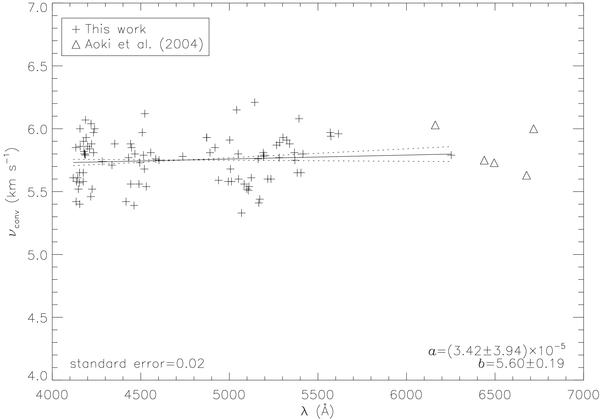
Values of νconv that satisfy the minimum value for
χ2 for the 93 lines (plus symbols).
The standard error represents the scatter from the mean of each line
( ) and a and b are
coefficients of the least squared fit,
νconv = aλ + b.
The Ca i and Fe i lines used by Aoki et al. (2004) to constrain macroturbulence have been plotted
(triangles) to show the consistency of our χ2 fits
with their results at red wavelengths.
) and a and b are
coefficients of the least squared fit,
νconv = aλ + b.
The Ca i and Fe i lines used by Aoki et al. (2004) to constrain macroturbulence have been plotted
(triangles) to show the consistency of our χ2 fits
with their results at red wavelengths.
Current usage metrics show cumulative count of Article Views (full-text article views including HTML views, PDF and ePub downloads, according to the available data) and Abstracts Views on Vision4Press platform.
Data correspond to usage on the plateform after 2015. The current usage metrics is available 48-96 hours after online publication and is updated daily on week days.
Initial download of the metrics may take a while.