Fig. 10
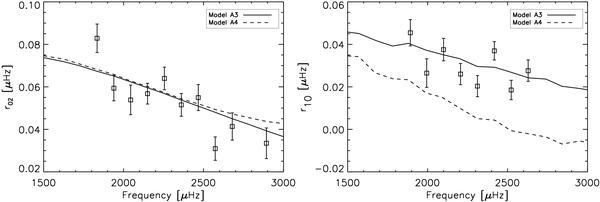
Left: comparison of the r02 constraint with the models A3 and A4. Right: comparison of the r10 constraint with the models A3 and A4. The data points seem clearly to agree with the model A3, a fact that was not established with the data of Bouchy & Carrier (2002). Indeed, all their points for the r10 asteroseismic constraint were situated between the curves of the models A3 and A4 (see Miglio & Montalbán 2005).
Current usage metrics show cumulative count of Article Views (full-text article views including HTML views, PDF and ePub downloads, according to the available data) and Abstracts Views on Vision4Press platform.
Data correspond to usage on the plateform after 2015. The current usage metrics is available 48-96 hours after online publication and is updated daily on week days.
Initial download of the metrics may take a while.